DigiWo

DigiWo

The further explained grasshopper scripts on the building volumes generation are the output of the DigiWo reserach cooperation between the Bauhaus University Weimar, Decoding Spaces GbR and DIPLAN (today: REHUB digitale Planer). This research was supported by the ZukunftBau Program by the Federal Ministry of the Interior, Building, and Community.

In the following tutorial, you will get introduced to a set of User Objects & Components for the semi-automatic generation of residential multi-family buildings, enabling a user to generate either an urban block or a slab typology, as well as provide the scripts with a predefined sequence, that can generate variations with minimal guidance. The video below presents the concept of how the generation process is organized.

Project Team:
Iuliia Osintseva (Author), Reinhard König (Supervisor), Sven Schneider (Supervisor), Martin Bielik (Supervisor), Andreas Berst (Contributor), Egor Gavrilov (Student Assistant), Martin Oravec (Student Assistant)

If you prefer reading over watching – here is the paper on the block generation.

Topics covered in tutorial:

Block Generation Components

1a. Basic Block

1b. Actions:

  • Delete Edges
  • Setbacks
  • Cornerbreaks
  • Random Breaks
  • Reduce Height
  • Towers (& Envelopes)
  • Yard Buildings
  • Rooftops

Slab Generation Components

2a. Single Plot Generation

2b. Subdivision of Complex Concave Sites

2c. Multiple Plot Generation


Part 1:

Block Generation Components

1a. Basic setup.

In order to start the generation, the minimal requirement is a closed planar polyline in Rhino, representing the construction site. Additionally, you can add a layer with lines, representing the street axis, as well as the neighbor buildings context on a separate layer. Both those layers will then be considered during the generation.

It is as well required to select the location of the building area in order to derive the correct spacing (see the video above to learn about the spacing concept). Further, you can select multiple values for the building depth to try out, as well as set up a range of the floors count for the basic block. The output of this step is a closed block (or a range of those) around the construction plot perimeter, considering the required spacing based on the block height.

It is possible though, that the spacing should be neglected, in case that your construction plot is placed within existing blocks and thus you should continue the street profile, placing the buildings right along the plot edge. In this case, you can just draw the lines in Rhino to indicate where the spacing should not appear, and insert them into „Baulinie“ input.

The resulting generations are gathered at the „House Instance“ data type, which is a combination of six different parameters: plot after spacing; surfaces; outlines (façade lines towards the street); inlines (façade lines towards towards the inner yard); depth of a building (as a number), floor count (as a number). Using Surface and Floor Count you can display the geometry preview as well as calculate the basic performance indicators, such as FAR, Site Occupancy, or Total Built Area.


1b. Actions over the Block.


1b.1| DELETE EDGES

This action can delete one or multiple edges to reduce the density or to solve a too narrow concave block intersection. You can select the edge to start with and decide on the number of edges to delete.


1b.3| SETBACKS CORNERS

This action creates a setback at the corner if the length of the adjusting edges is sufficient and the setback does not cause an intersection. You can select the edge for generation, dimensions range for the setback parameters and a seed for the randomness.


1b.5| CORNERBREAKS

This action creates passageways in the block‘s corners, thus avoiding the creation of corners that are rather difficult for the later apartments placement. You can change the width of the passageways as well as the directions of the cuts.


1b.7| ENVELOPES

This action creates a spacing envelope, as well as both summer and winter solar envelopes (with the help of LadyBug tools). Informed by those envelopes, you can place buildings that act according to the local requirements, or that are placed to minimize the influence on the lighting conditions for the neighbor buildings around the given site.


Download Grasshopper file

1b.| YARD BUILDINGS

This action creates buildings within the block yard after the user-drawn axis. You can select the depth of the yard buildings as well as their floor count.


1b.2| SETBACKS EDGES

This action creates a setback along an edge if the edge length is sufficient. You can selecte the edge for generation, dimensions range for the setback parameters and a seed for the randomness.


1b.4 | RANDOM BREAKS

This action creates passageways through the block perimeter at either random, or user-driven spots. You can select the total amount of area to delete or the total width of the passageways, as well as the number of random options to try out per input block.


1b.6 | REDUCE HEIGHT

This action cuts the block through the corners and reduces the floor count of some of the building fragments. Here, you can indicate the total amount of area to delete. This actions creates several different height profiles per input block.


1b.8 | TOWERS

This action places one or two towers along the existing block perimeter in order to gain extra area. You can select the desired area per tower, restrict the extra floors, or assign a point where the tower should be located if you dont want random generations to appear. The limit of tower height is resulting from the envelopes script.


1b.10 | ROOFTOPS

This action creates offsetted rooftop floors over the block perimeter. You can decide on the orientation of the buildings (toward street/yard), depth, and their overall amount.


1c. Examplatory Generation Sequence

In the following video you‘ll find an examplatory combination of actions for generating a bunch of various building volumes for one construction site, including the parameters setting for each of the actions. Keep in mind that the suggested sequence is not the only possible one, and you can try to arrange actions in another way, and thus receive different results.


*please remember to unblock the .gha components before inserting them into your Libraries folder

Part 2:

Slabs Generation Components

2a. Single Plot Generation.

Here, the generation logic is slightly different than it was the case for the block typology. Whereas block was about offsetting and further modifying the site outline, slabs is about the pattern of the placement of several simple forms on the given site. Therefore, it is possible to order several slabs at one site. First, the site edges are translated into 4 characteristic edges based on the angles between them.

Further, slabs can appear along each of the edges – as long as the space is sufficient.


Depending on the selected order of the edges, the pattern of the slabs allocation can differ greatly.


Accordingly, each further parameter to influence the slabs pattern is repeated four times in order to allow different variations along each of the edges. In all further parameters, the order of the values will be applied accordingly to your selected order of the site edges. You can re-adjust the edges order at any later moment of the generation. Below, you can find a short video with the overview of the parameters that you can influence for the slabs typology.

2b. Subdivision of Complex Concave Sites and Multiple Plots Generation

In case of large area plots, such generation might cause monotonous strict patterns, non usable for modern urban plannings. In order to escape this, we developed a method on the subdivision of the big concave plots into smaller and simpler sub-fragments. Those sub-plots can then be filled with slabs in a single direction.

In the previous part, there were nine parameters for each slab raw at a single edge. In the case of generating slabs for multiple plots at the same time, the number of parameters gets multiplied accordingly. As follows, taking control over generation becomes exhausting. That is why for the multiple plots generation it was decided to leave only single-direction slabs. However, the user can decide between different orientation patterns as well as subdivision patterns himself, thus still exploring the design space to a several extent. In the following video you can see the brief overview of parameters to guide the generation for the slabs typology at multiple sites.

Urban Planning Table – Integrated Infrastructure

Urban Planning Table – Integrated Infrastructure

Video with impressions of the urban planning table, a walkthrough and created plans of all participants.

Introduction

Many different urban stakeholders such as authorities, planners, investors or local residents are involved in urban planning processes. Coordination and communication between the parties involved is often difficult, especially since not all parties have the same level of knowledge. This is particularly problematic when plans are not understood by those affected by the planning decisions.

The Ethiopian Ambassador in Germany (right) listens to our explanation of the project.

 As part of the research project “Integrated Infrastructure – IN3”, we want to support planning participants in developing Ethiopian villages into towns in tow ways. First, we create and discuss digital tools with the participants to enable fast urban planning. Second, we experiment with explanatory communication tools to provide village residents and local authorities with easy-to-use and game-like access to planning to enable conscious, participatory decision-making.

In a discussion with village representatives, we gained valuable insights using a prototypical communication tool. We drew attention to drastic changes in the village environment during a growth process from previous population of approx. 1,000 to the expected 10,000 inhabitants. This highlighted, for example, how land use and water infrastructure would be affected.

For the exhibition “ሠላም Bauhaus” (Selam Bauhaus), we designed a simplified version that should give the users access to planning aspects in a fictious Ethiopian context without further help. The generated planning scenarios surely do not represent the final plans. We hope, however, that this type of interaction will stimulate discussion and reflection on new possibilities for planning and participation.

“I believe that we need more knowledge and experience on town planning”

– Villager

“The supportive maps and their relation to the existing context that you presented today are very interesting. We feel happy about the maps of our village that you […] showed us. You showed us, how the growth and plans can affect our village.”

– Local representative

“This kind of planning is an improvement for our generation. We are in the 21st century and our aim is to give farmers and the rural community this opportunity of empowerment.”

– Local representative

User Experience

Being confronted with the complexities of planning and the multitude of challenges that arise, a user would be overwhelmed by the amount of information. Although the exhibited urban planning table simplifies planning relevant issues to estimatable and visualisable results, a direct confrontation with all parameters would lead to a visual clutter. Therefore, planning issues and population growth are introduced step by step with assisting information and contextutual visualisations:

1. Placement of city and setting its density – The city is small with a population of 1.000 inhabitants. The user has time to get used to the navigation and can move around the city through interaction with its icon.

2. Prioritising areas for agriculture or forest – The city grows to 3.000 inhabitants. A slider is introduced to weight the importance of nature against jobs in food production. The user can explore the difference not only on the map but also through performance evaluation.

3. Loss of agriculture demands new employment – The city has a population of 6.000 inhabitants. A new icon for industry is introduced. Moving it around affects air quality. Through two new sliders jobs in commercial or industrial sector can be created. It affects directly the land use plan of the city.

Exhibited Planning Table with an interactive map, the four planning steps on the bottom and performance evaluation on the upper right.

4. Satisfying water demand – The city reaches a population of 10.000 inhabitants. A water drop icons is now available and sets the location of a water tank. To reach water supply for every household the water pressure needs to be high enough and therefore the water tank should be placed on high altitude.

Finish. Based on the four steps, the user can simulate the population growth through usage of a slider. Within the exhibition, the final plan has been print out for the user by the tool. 

The interaction with the planning table happens through intuitive touch commands and the user is continously informed on the feasability of the chosen city layout through real-time performance evaluation.

Rotate Camera
Camera Zoom
Move Camera
Move Objects
Performance Evaluation

Performance Evaluation

The urban planning table evaluates certain factors such as walkability, water demand, infrastructure affordability, air quality, employment and connection to nature to give continous feedback on planning relevant issues. The planning table users will realise that the factors are interrelated and a benefit for one criteria will challenge another. Therefore, the users will have to weight and compromise on their own demands. The criteria are explained in more detailled:


Walkability

In a city of short distances, the most important facilities can be reached quickly. The closer people live to each other, the easier it is to meet on foot. A round city would be ideal, but there are other factors that belong to a good city. So is it worth losing a bit of walkability for other qualities?


Nature

Sufficient green spaces are important in many ways. Forests in particular can improve air quality, protect soil from erosion and prevent rain from seeping into the ground too quickly. In addition, green spaces close to cities can also be used for recreation. However, they are also an important building material that requires space and time. So to what extend should forest be given space?


Employment

Agriculture cannot provide enough jobs for a growing population. New commercial and industrial land use can help here. If too few jobs are available, parts of the population will have to work in neighbouring cities or will not get a job. If too many are available, there is a danger that no one will be able to occupy them or that commuter traffic will be too high. With which mix of functions can a balanced employment be achieved?

Water & Affordability

In order to supply a city with water, physical rules need to be considered. If there is not enough water pressure at a tap, no water flows. The pressure results from the difference in height between tank and tap, accordingly a water tank should be located high and close enough to the city. Furthermore, the larger a city is, the more expensive the infrastructure becomes. A dense city is therefore often cheaper to maintain. Where is an optimal location for a water tank for an affordable and complete water supply? 

Air Quality

A city with fresh air has good conditions to be a healthy city. However, industry produces dirty exhaust air, which is blown into the residential areas by the wind. The local weather has east and west winds, depending on the day. The wind is visualised by the smoke clouds. So how should industry be placed to avoid pollution of the city?


By combining hard factors calculated by the computer with soft factors evaluated in discussion rounds. People who know little about urban planning can be involved in the early stages of the planning process and gain important decision-making competencies. According to the feedback given to us, we will continue improving and extending our tools and hope to share the results in the near future.

1/18

Now I am wondering how it looks on the ground?

2/18

I like that this city has a lot of green! City, people and nature are in balance and the air quality is good! Like to LIVE HERE!

3/18

A very cool Project. It will be the future of design so that human have more time to think about details.

4/18

Richtig cool, aber Navigation mit zwei Fingern funktioniert nicht so richtig gut. Ansonstend spannend!

5/18

good air is the most important!

6/18

Being an Ethiopian myself i am sure that this would play a handy role through the process of achieving a responsible and responsive design our country needs.

7/18

Great stuff!

8/18

Gutes Tool, um strategisch denken zu lernen! Education?

9/18

Maybe we can extend the design table to mobile device.

10/18

very interesting simulation

11/18

Wonderful simulation ♥ interactive+++ – More forest, less industry! Maybe some other employment options (services instead of industrial production? 🙂 )

12/18

This table should have as many variables as it can (sanitary lines, electical, public areas etc.). Maybe make two versions easy (now) & hard for academics.

13/18

I like this one ♥

14/18

sehr anschaulich!

15/18

🙂

16/18

shows consequences of planning directly

17/18

a very nice Simulation – also from an IT Perspective!

18/18

Ich finde das Programm fragwürdig. Auf jeden Fall eine gute Lösung um schnell etwas geplant zu haben. Trotzdem finde ich, dass so eine Art zu planen gegen die Realität stößt. Bspw. wo bekomme ich das Wasser her? Wie kann ich das Grüne unterhalten? Sind die Gegebenheiten dort für Industrie?… etc.

Acknowledgement

Integrated Infrastructure (IN³ – uni-weimar.de/integrated-infrastructure) is an interdisciplinary international research project at the Bauhaus-Universität Weimar (BUW) and the Ethiopia Institute for Architecture, Building Construction and City Development (EiABC) working within the Emerging Cities Lab – Addis Ababa (ECL-AA).

The urban planning table is conceptualised and developed within the Integrated Infrastructure Research Team.
EiABC: Zegeye Cherenet, Tesfaye Hailu, Ephrem Gebremariam, Kirubel Nigussie, Metadel Selashi, Bilisaf Teferri, Israel Tesfu
BUW: Andreas Aicher, Nicole Baron, Martin Dennemark, Philippe Bernd Schmidt, Sven Schneider

Interface design and programming of the planning table by Martin Dennemark

The project is funded by the Federal Ministry of Education and Research in Germany (BMBF), German Academic Exchange Service (DAAD) and German Aerospace Center (DLR).

Satellite imagery aquired through educational license from © Planet Labs Inc. www.planet.com.


Magnetizing Floor Plan Generator

Magnetizing Floor Plan Generator

Presented project can be considered as an exploration of various ways of generating floor plans for public
buildings. Public buildings were chosen because of their complex and non-standardized structure. The aim was to
try different approaches, choose the best methods and incorporate them into my own algorithm.

Project Team:
Egor Gavrilov (Author), Reinhard König (Supervisor), Sven Schneider (Supervisor), Martin Dennemark (Supervisor)

Introduction

For architects as well as developers and urban planners working on the floor plans or estimating the shape and dimensions of large buildings is always a challenge. This task requires some knowledge and what is more important – even with understanding of the process it is a very time-consuming task. One should take into consideration the arrangement of all rooms as well as adjacencies and connections of main spaces. Generally, for every different shape or position of the building’s footprint the whole new room structure should be created.

The statement was put on as a starting point: Each of the rooms in a building is somehow accessible from any other room. It means that the whole communication structure is interlinked and thus forms the core. It could be said that the first step of the generation would be developing an evacuation plan, which can later be converted into more intelligible communication network.

Every room is extended by a corridor, which goes along one, two or four of its sides. Rooms are placed one-by-one in such a way, that every placed room should be attached to the main corridor structure with its own corridor. Additionally, every room should be adjacent with all required rooms. This process continues until there is no suitable space left for the next room. After that the new iteration starts and a new variant is generated. Simultaneously previously computed solutions are developed with the help of quasi-evolutionary algorithm. Eventually, the generator produces a huge number of solutions and then the best one is chosen, according to the evaluation function (generally number of the rooms placed or the total area of the rooms placed provide the most comprehensible evaluation results).

Generation Algorithm

// PREPARE INPUT

  •  rotate boundary
  •  sort rooms by their connectivity
  • find first room

// ITERATION 1

  • Place 1st room
  • Find the room that is connected with 1st room -> place it
  • Find the room that is most interconnected with currently placed rooms -> place it
  • If the room can’t be placed -> stop iteration and start over
  • Generate couple of solutions in this way -> choose 5 best of them and remove others

// ITERATION N

New iteration: improve previous solutions and generate new ones:

  • If (iteration % 3 == 0) -> Take all previous solutions, remove last 1-5 rooms and try to place them differently again.
  • If possible to place more rooms than originally, then replace old solution with this one.
  • If (iteration % 3 != 0) -> develop new solution

// END OF ITERATIONS

  • Generate couple of solutions in this way -> choose 5 best of them and remove others
  • Choose the best solution and generate output from it
  • If needed, remove dead ends and convert halls to corridors

User interface

Ease of use was considered as a crucial feature since the beginning of a project. Therefore, a simple solution for managing a room program of a house was created for the grasshopper environment. It enables user to set basic parameters, such as room name, area, room connections, entrance location, type of space (room/hall).

Expreimentation

Spatial Resilience Towards Flooding Hazards

Spatial Resilience Towards Flooding Hazards

Urban development projects in flood-prone areas are usually complex tasks where failures can cause disastrous outcomes. To tackle this problem, we introduce a toolbox (Spatial Resilience Toolbox – Flooding, short: SRTF) to integrate flooding related aspects into the planning process. This so-called toolbox enables stakeholders to assess risks, evaluate designs and identify possible mitigations of flood-related causes within the planning software environment Rhinoceros 3D and Grasshopper. This states a convenient approach to integrating flooding simulation and analysis at various scales and abstractions into the planning process. The toolbox conducts physically based simulations to give the user feedback about the current state of flooding resilience within an urban fabric. It is possible to evaluate existing structures, ongoing developments as well as future plans. The toolbox is designed to handle structures on a building scale as well as entire neighborhood developments or cities. Urban designers can optimize the spatial layout according to flood resilience in an early phase of the planning process. In this way, the toolbox can help to minimize the risk of flooding and simultaneously reduces the cost arising from the implementation and maintenance of drainage infrastructure.

Research Team: Julius Morschek (contact author)Reinhard Koenig (contact author) and Sven Schneider 


Acknowledgment

This page contains accompanying material for the SimAUD 2019 conference paper “An integrated urban planning and simulation method to enforce spatial resilience towards flooding hazards“.

Presentation at SimAUD conference, Georgia Tech, Atlanta GA, April 2019

RAIN-RUNOFF SIMULATION

The rain runoff simulation is conducted with the help of the interactive physics/constraint solver Kangaroo for Grasshopper by Daniel Piker. The toolbox can represent a rainfall event by equipping particles with a certain mass and gravitation force. During the simulation, the particles are attracted by the external gravitational force, which results in runoff. Thereby, the particles search for ways downwards comparable to rain runoff. They behave as spherules running off the 3D geometry.

TIDAL & RIVER FLOODING SIMULATION 

The second simulation the toolbox is capable of is the tidal and river flooding simulation. It illustrates and evaluates the impact of different water levels in the area. To measure the inundation, a plane is moved from a given altitude up to a predetermined value. The plane is considered as the surface area of a river, lake or the sea. To get precise information about which part of the geometry is flooded, the toolbox calculates the intersection between the plane and the surroundings.

RAIN-RUNOFF INUNDATION RISK

The SRTF provides information about the status of flooding-resilience for urban inundation, tidal and river flooding. The rain-runoff simulation provides information about the status of inundation and the level of erosion in the area.

The risk assessment of the rain runoff inundation is conducted based on the location of each particle after the simulation. The toolbox counts the number of particles that are in a specific range within every building. The range is set to two meters by default. This allows compromising the rating of a building in a negative way when it is surrounded by water under pressure. The value of the range distinguishes water that is running along the housing units from water that accumulates and pushes against buildings. Then the number is divided by the footprint area of each building. The higher the value the greater the risk of damages through flooding. This means that the density of particles near or at the buildings is responsible for the outcome of the evaluation. Buildings with a high risk of inundation are always characterized by an accumulation of particles nearby. The street network is treated similarly. Each street is further divided into segments at junctions or bends. Then the number of particles measured that are within a specific range near each street segment. The value is the same that is used for the housing units. The number is then divided by the area of the range. Now each building and each street segment is assigned with specific risk value. The information is visualized with color gradation in the viewport.

RAIN-RUNOFF EROSION RISK

With the outcome of the rain runoff simulation, one can also conduct the rain-runoff erosion risk evaluation. Hereby the path of each particle is used to evaluate the runoff erosion risk. This helps to mitigate fast runoff and therefore the risk of damages caused by erosion, debris, and landslides. Urban planners can take this information into account when developing buildings, neighborhoods or cities. The toolbox visualizes the evaluation by means of the flow paths. Combined with the description of the velocity the user gets profound data for the area. The first concept seems to perform better because the affected area is smaller. But as it is visible in, the runoff in the east gets slowed down by the green space in front of the houses. That means that the buildings are not harmed by the debris. By contrast, in the first proposal, the overall area at risk is less but the buildings that are affected are hit directly by the fast runoff. 

TIDA & RIVER FLOODING – RISK EVALUATION

The figures above depict the outcome of the tidal & river flooding simulation. The legend in the left bottom corner states, that the first concept hosts its housing units in a way that during a high tide of 8 meters, there are 32 buildings flooded. At the same water level, there are only 25 buildings at stake in the second concept. This means that 7 homes can be saved from severe damages due to flooding by changing the spatial layout. 

During the simulation, the risk assessment for the houses and the street network is presented. When the water level reaches the top of a platform of a building, it is marked with a red color. The toolbox applies a darker tone of red according to the depth of water. The depth is computed by iteration so each frame represents a depth of eight centimeters. It counts the number of iterations after a building is considered as flooded. In this case, the water levels that are deeper than 24 centimeters are considered equal. The values can be adjusted as needed. For this case study, the value is set to balance imprecisions and to match the threshold of lasting damages. The same methodology for assessing the risk applies to the city network. Hereby the lowest point of the street segment is evaluated. When the water reaches it, it is marked with a red color in the same manner as the risk assessment for the buildings.

TIDA & RIVER FLOODING – MEAN RISK ASSESSMENT

The last part of the evaluation phase is called the mean risk assessment. It is related to the tidal and river flooding simulation and gives an understanding of the risk distribution in the area. Whereas the prior evaluation is useful for evaluating the site for specific water levels, the mean risk assessment shows the risk of all scenarios combined. In this case, every single state of the tidal and river flooding simulation is recorded to compute the mean value. The toolbox then colors all affected buildings and street segments according to its mean associated risk from low to high. 

The mean risk assessment provides useful information about locations that are not endangered by flooding and therefore suitable for e.g. housing units. Alongside comes the ability to divide a plot into parcels with different functions. For example, locations with a high risk of inundation are not suitable for housing or commercial estates but rather can be used for green spaces or public spaces with mobile structures such as markets.

WORKING WITH THE SRTF

Based on the evaluation of the two proposals, we prepared a third concept with minimal interventions. The result is proposal 3 and can be seen in the figure above. Now there are three ditches aligned downwards to control the runoff. Two are located in those areas where there were strong accumulations visible in the rain runoff inundation evaluation of proposal 2. One is in the north and one is in the eastern part of the region. Both ditches were trenched into the ground and both reach down to the shoreline. The third ditch is situated at the western border of the third district. Besides that, there is now a bridge over the ditch, connecting the second district with the surroundings. The third measurement is forestation in those areas where the risk of erosion is particularly high. The trees are illustrated as green dots in the viewport. Lastly, we elevated the living quarters of the Rubahs that are affected by tidal and river flooding. 

The significant change of the rain runoff inundation evaluation is the reduction of affected Rubahs by more than 50 percent. The rain runoff erosion evaluation shows significant changes as well. Due to forestation, the endangered area is decreased to 0.38 hectares. Regarding the tidal and river evaluation, the third proposal performs better as well. The number of homes vulnerable to flooding decreased by 20. The legend of figure 21 states, that there are still two Rubahs in the north with a mean risk value of over 50 percent.

Download the Rhino3D/Grasshopper Source Files

Please enter a password to see the content:


Wrong password, please try again
Urban Elements

Urban Elements

This blog post aims to expand the discourse on parametric urban design education by introducing ‘Urban Elements’ as conceptual urban design instruments with an inherent rule-based logic, which can help to bridge gaps in teaching parametric urban design thinking. It is the result of a course developed for and delivered to the Urban Redevelopment Authority (URA) in Singapore in 2017 and 2018 by the Future Cities Laboratory at the Singapore-ETH Centre.

Research team: Aurel von Richthofen, Katja Knecht, Yufan Miao, Kateryna Konieva, Dr. Reinhard Koenig

The ‘Urban Elements’ included ‘infrastructure’ such as urban grids and networks, formation of blocks and building plots, creation of built volumes, distribution of massing and functions. This menu of generic urban design patterns provides the key components for solving basic urban design problems. The parametric logic of the GH definitions provided introduced corresponding basic concepts of parametric thinking.

Download GH files

Examples of generic urban components taught prior to the beginning of the term in the boot camp (chart with grids, plots, massing, functions).

Examples of urban concepts taught during the term and translated into Grasshopper tutorials.

Further parametric example definitions were introduced throughout the term addressing related concepts that corresponded to the topic of the weekly lecture. Concepts covered aspects of urban form, such as plot porosity and street profiles, function distribution, reworking topography and topography evaluation, shortest path, energy calculations with the plug-in Ladybug and designing for change using the Elefront plug-in. The sample definitions and basic parametric and urban concepts covered by the tutorials were intended to provide a starting point for the participants to aid them in the development of their own parametric translations. In analogy to Christopher Alexander’s ‘Pattern Language’ these parametric urban concepts formed a basic vocabulary for the participants, which could be recombined and expanded.

Download GH files

Collection of ‘Urban Elements’ developed by participants during the course. Poster design by Binger Laucke Siebein.

Related Publications

Sorry, but the selected Zotpress account can't be found.

Working with and Exporting Geospatial Data

Working with and Exporting Geospatial Data

We are introducing an upcoming set of features that enable Grasshopper users to work with geospatial data and export the project in the GeoJSON format that can be used to generate web maps and other interactive web content. 

In the first part of this introduction / tutorial I will give a brief overview of the new components. In the second part I will present the Mapbox platform, which offers web maps creation trough user-friendly editing interface without the requirement of prior web developement experience.

Research Team: Ondřej Veselý, Martin Bielik, Dr. Reinhard Koenig

You can download an early test release of components used in this article here.

Spatial Reference components|   

Give access to WKT (Well-known-text) definition for any spatial reference system (SRS) your data could use.

EPSG:4326 component provides you with WGS84. This is basicaly the default SRS that you should use for exporting your data as GeoJSON.

Get UTM component gives you UTM system used at the given location. This is the SRS your data were probably reprojected to, if you used plugins like Gismo or Elk2.

Get WKT component queries spatialreference.org for any other arbitrary SRS and gives you the WKT definition.

Reprojection components |   

Use ProjNET and GeoAPI libraries to reproject a set of points / coordinates from one SRS to another.

Transformation component generates a transformation guide that you can use to reproject points from one SRS to another.

Reprojection component transforms coordinates to target SRS using guide from Transformation component.

Source Offset component helps with cases, when your source dataset was translated from it’s original position in it’s respective SRS to Rhino origin point (or any other).

(Both most popuplar plugins for getting geospatial data into Grasshopper – Gismo and Elk2 – are guilty of doing this).

Decompose Extrusion component |  

Helps you preserve 3D geometry, since GeoJSON doesn’t have native support for extrusions or meshes.

Decompose Extrusion takes any breps or meshes and gives you their footprint and z-axis minimums and maximums. You can then export them as polygons with height informaton included as property.

GeoJSON components |  

Convert Rhino Geometry to GeoJSON Features. Each branch of Grasshopper data will becomes single Feature.

Points component converts Points to GeoJSON Point, or MultiPoint if it recieves mutliple objects.

Lines component converts Lines or Curves to GeoJSON LineString, or MultiLineString if it recieves multiple objects.

Polygons component converts Curves to GeoJSON Polygonor MultiPolygon if it recieves multiple objects. Will create only simple polygons without holes!

Complex Polygons component converts Curves to GeoJSON Polygons. It supports inner holes. First curve in the list will be the exterior curve, the rest will be interior.

GeoJSON Export components |  

Creates a GeoJSON file from your geometry features.

Merge GeoJSON component takes GeoJSON Features or complete FeatureCollections and merges them into single FeatureCollection (always do this before exporting).

Write File component saves a list of strings (texts) into text file on your computer (Therefore it’s use is limited not only to saving GeoJSON).

Uploading to Mapbox

With your geospatial data exported from Grasshopper, next thing you could want is to bring it to the web. Currently there are multiple open projects focused on the issue of Web Mapping (see Leaflet, OpenLayers, Mapnikthat allow you to build your web map application from the ground up, but that could be an overhelming task to anyone without previous knowledge of web development.

For those who are not comfortable around developing apps with JavaScript, I recommend looking into Mapbox. It’s an open source mapping platform, that integrates all the neccesary web technologies into one package. You can control most of the basic aspects of your web map trough Mapbox Studio, a visual interface for managing your geospatial data and controling how exactly will it be displayed to the end-users.

To prepare the data for use in your web map, it has to be first processed into vector tile sets – basically splitting the  data into smaller chunks. Luckily, Mapbox will handle this automaticaly and host your tile sets on their server.

Just upload the GeoJSON file as a new tileset and see for yourself.

Tip: There’s of limit on maximum number of user tile sets used in one map (15).

Try combining your data into single GeoJSON/tileset and then use filters to get specific data sets back. It will also save you time when reuploading updated data later.

To create your own map, you first need to create a new Style – you can also copy one of the exisiting ones. Then add your vector tile data as additional Layers to the Style. You can modify the Layer style properties, ie. colour, stroke witdth etc., directly in the interface and immediatly see the visual changes.

Once you are happy with the result, hit Publish to update the Style and Share to generate a link that anyone can use to view the map.

Done! It was that easy. 🙂

However, if you are interested in adding some interactivity to your model, you will have to get yourself familiar with JavaScript library called Mapbox GL JS.

Mapbox GL JS is a JavaScript library that renders vector tile data from Mapbox to your browser window, but you can also use it to add custom functionality to your web application.

It’s pretty accessible even for first time JavaScript users, since it’s very well documented including many examples for any basic functionality you would like to include.

Congratulations! If you followed trough the steps, your  project should be now ready to be uploaded to web and shared with the rest of the  world!

Below you can explore an example of a project we have published using the methods described.

.

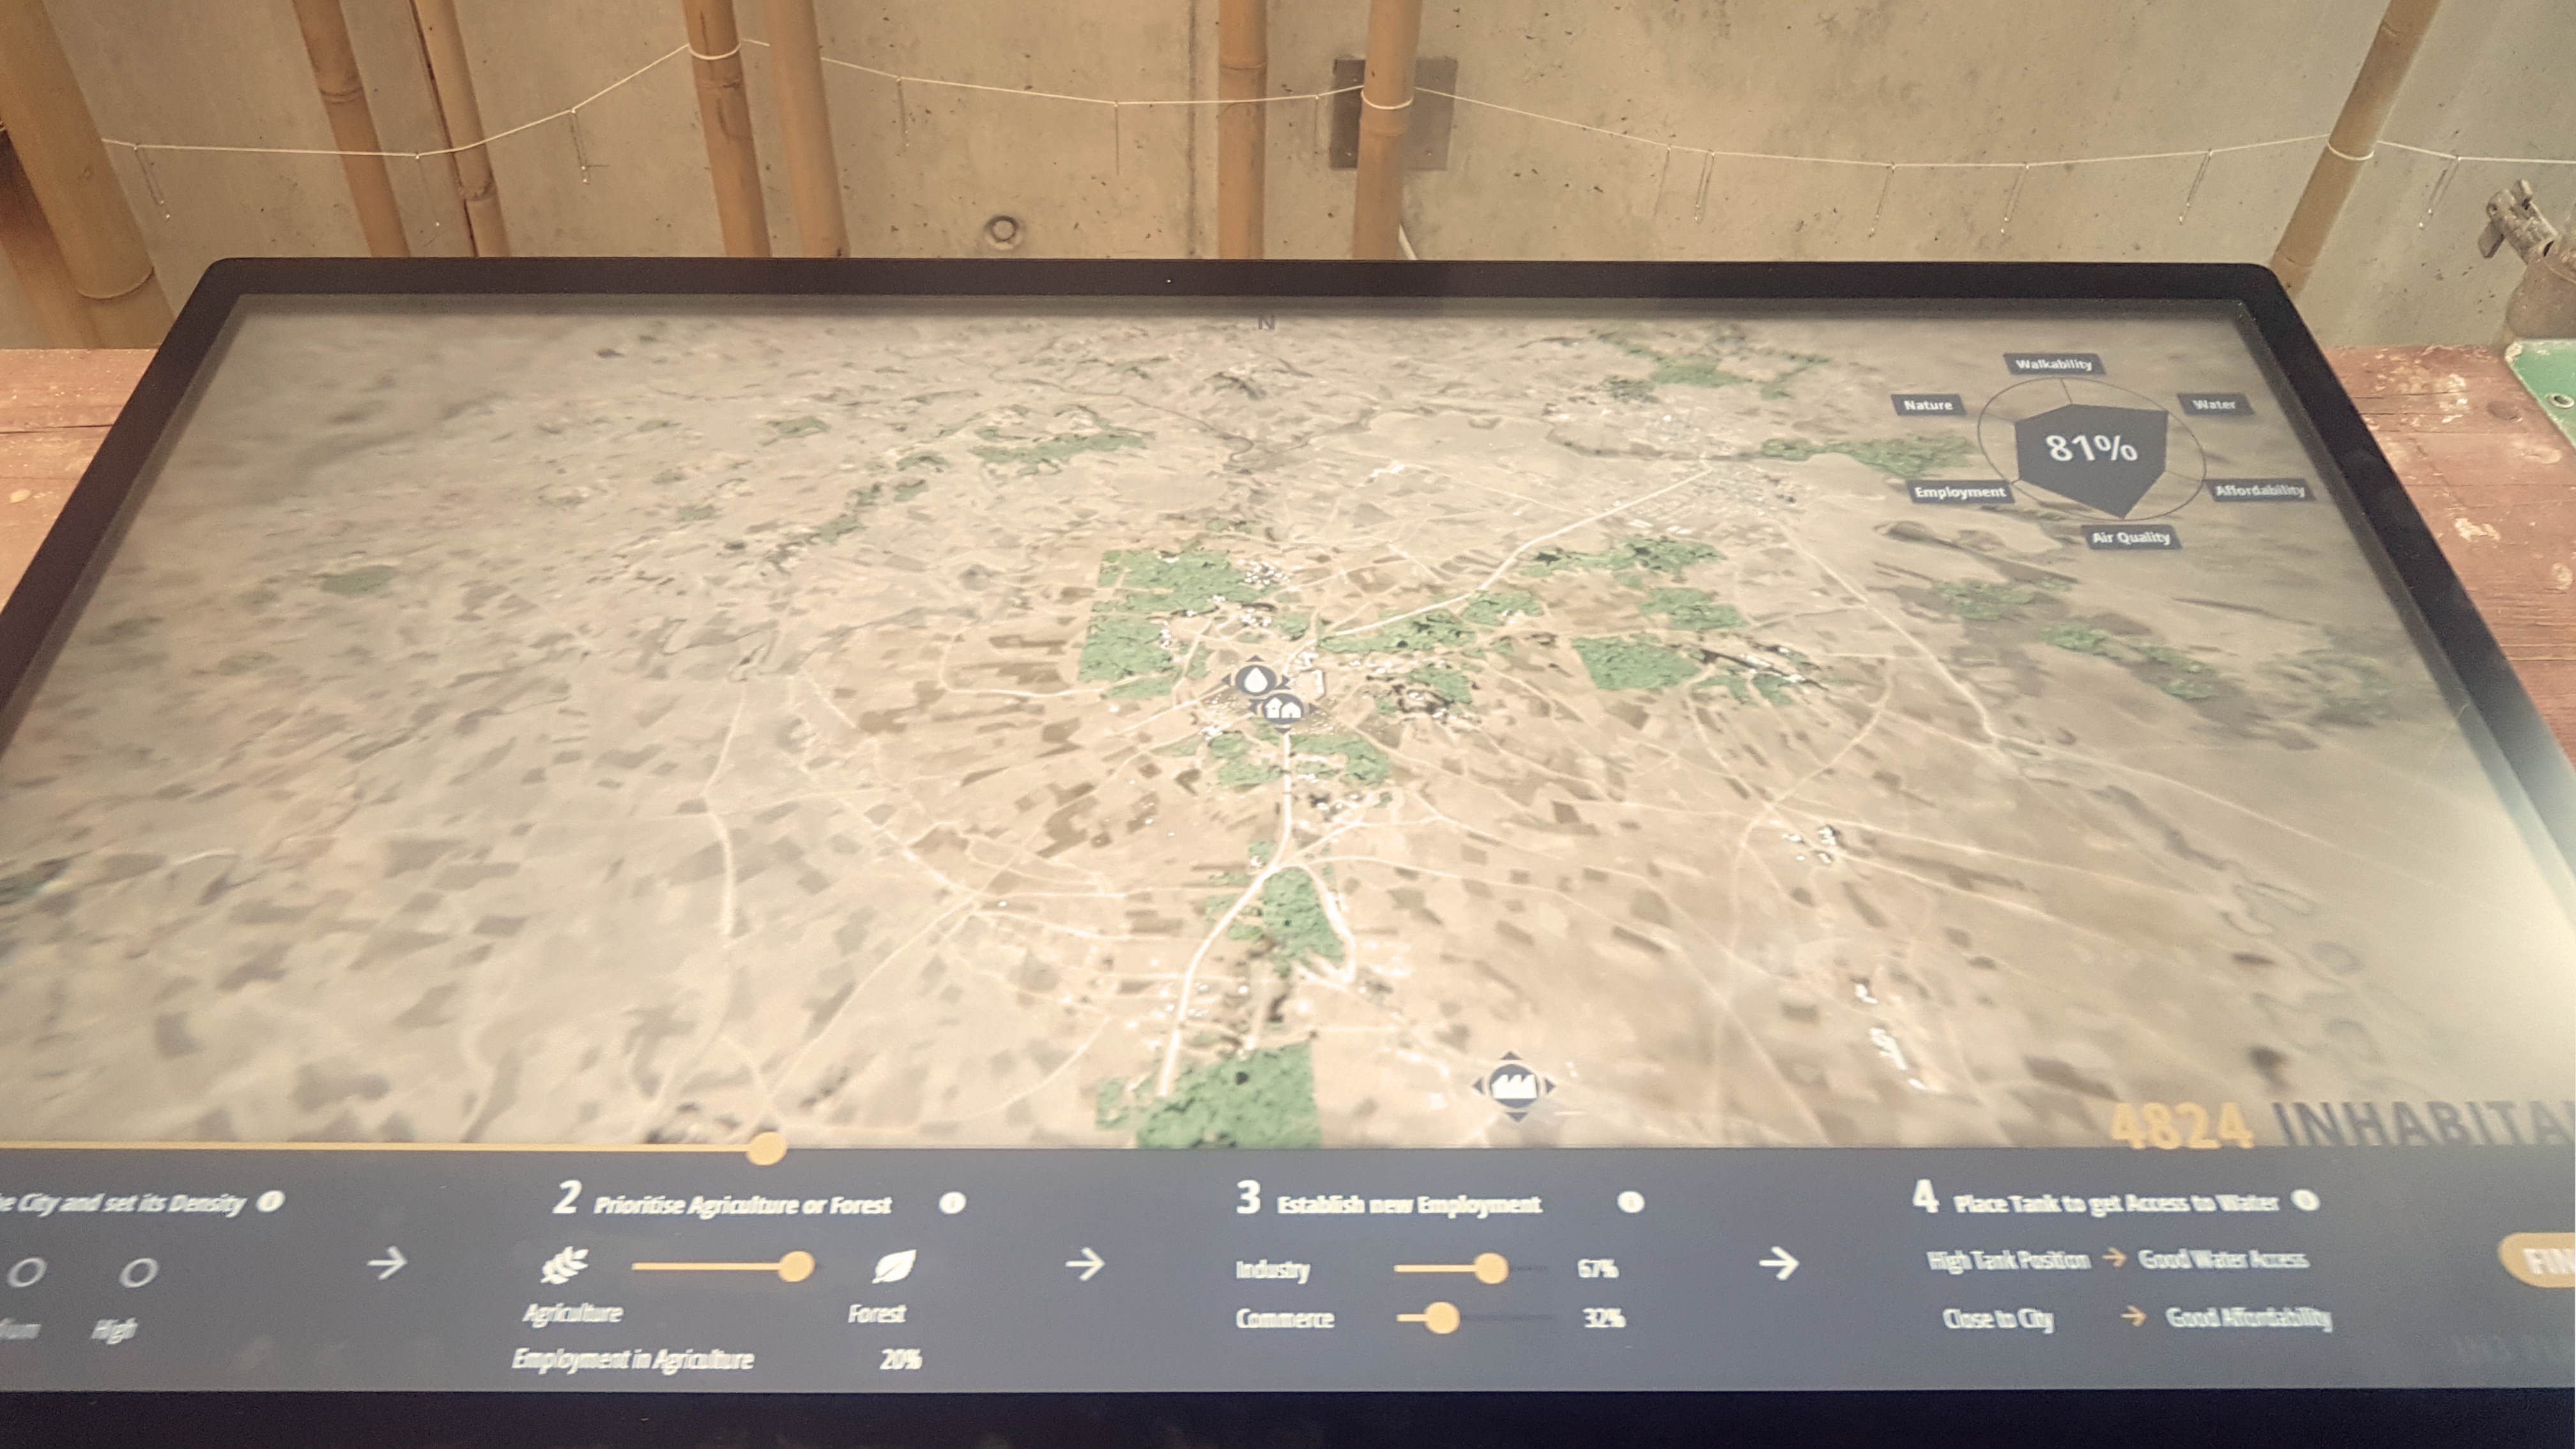
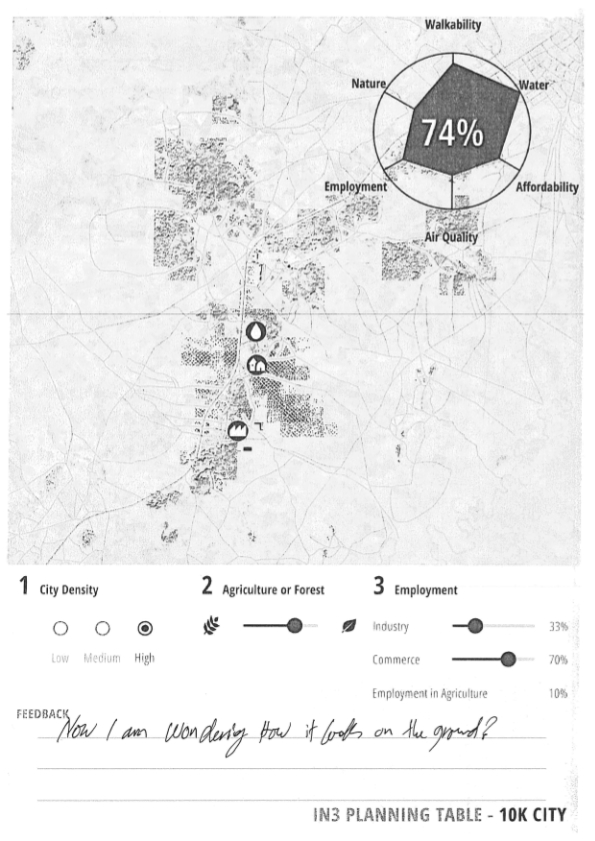
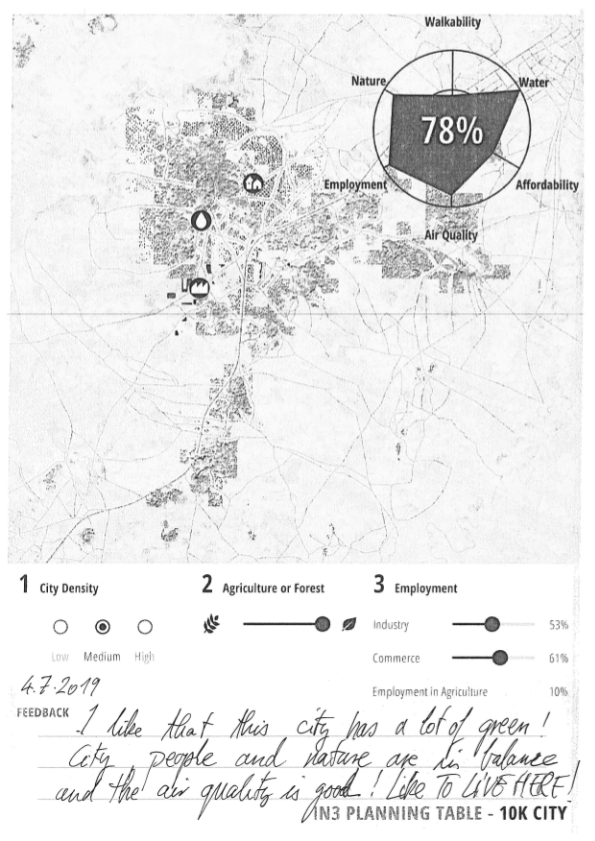
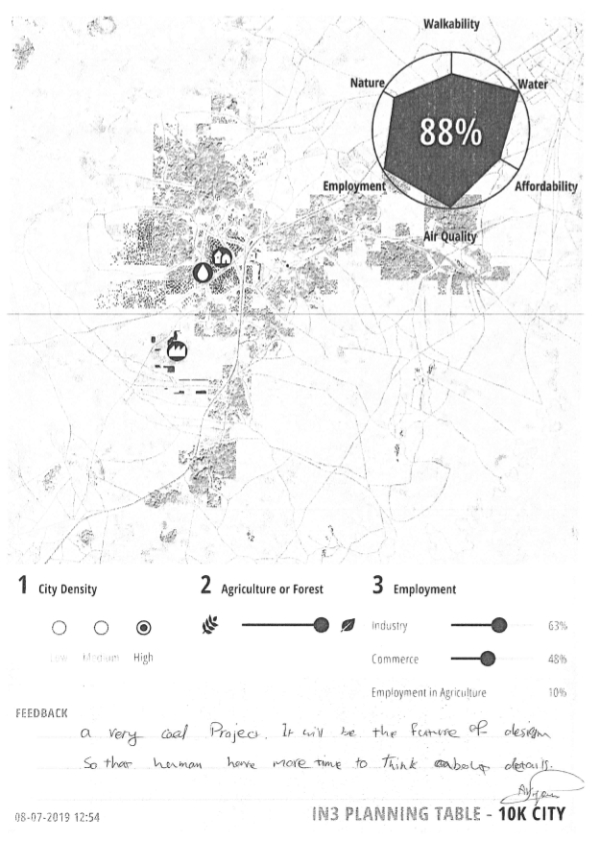
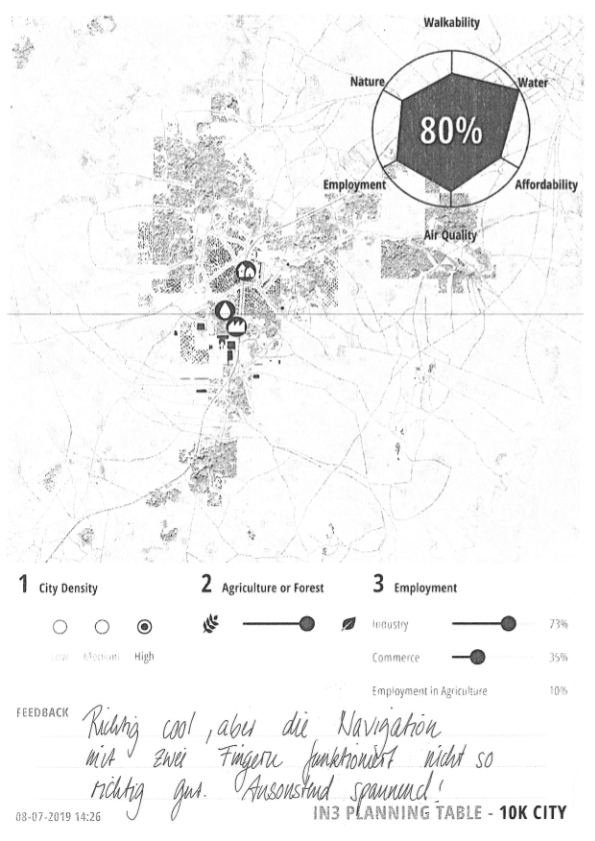
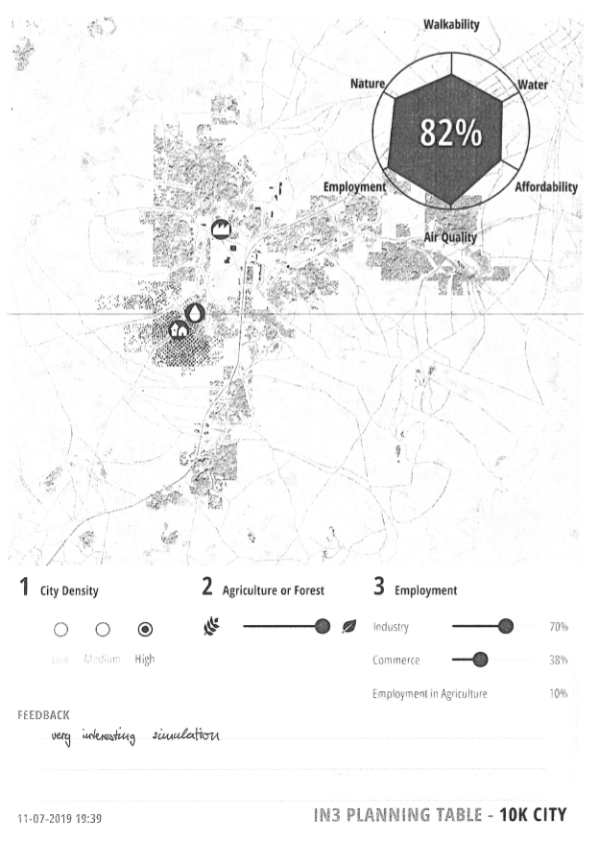
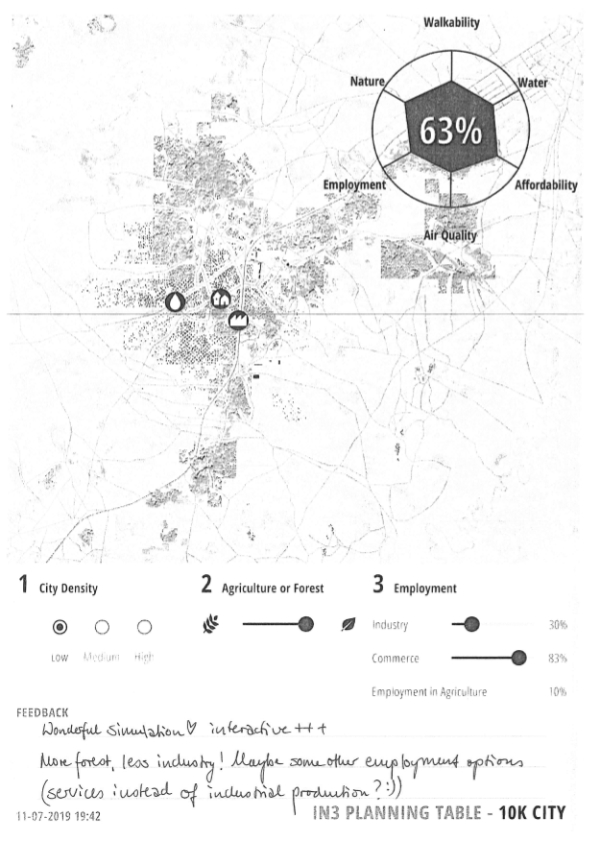
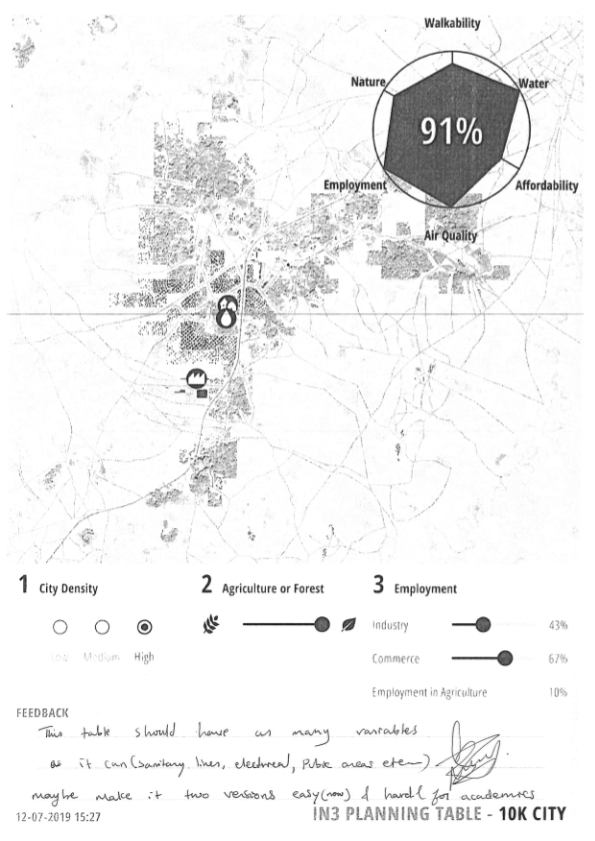
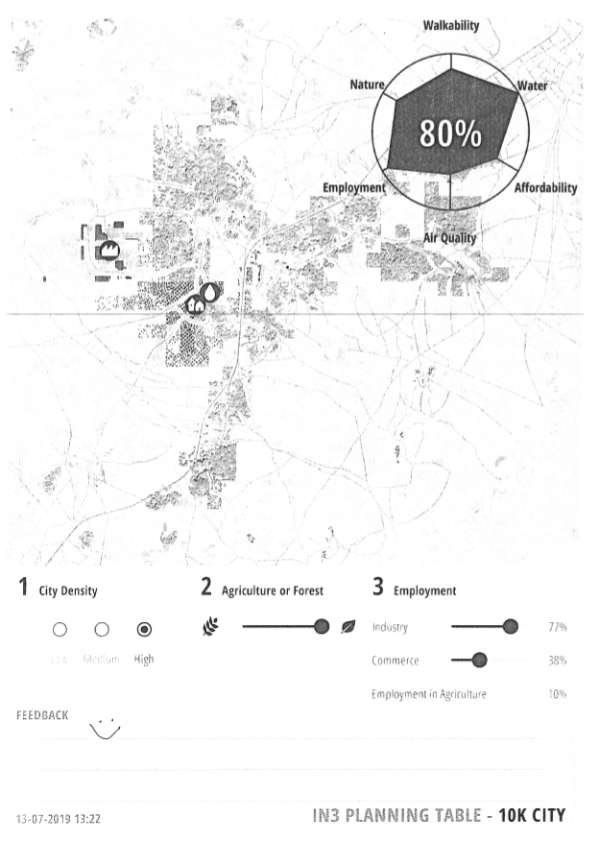
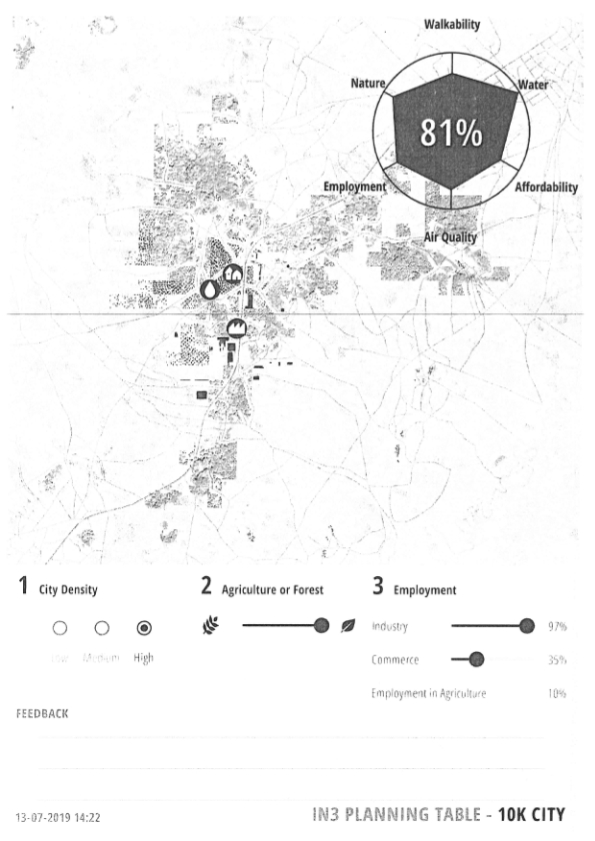
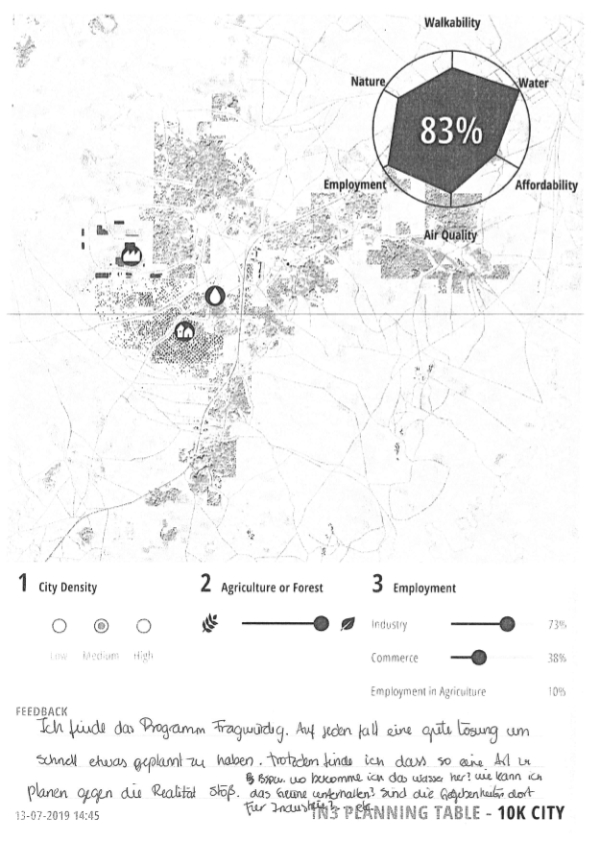
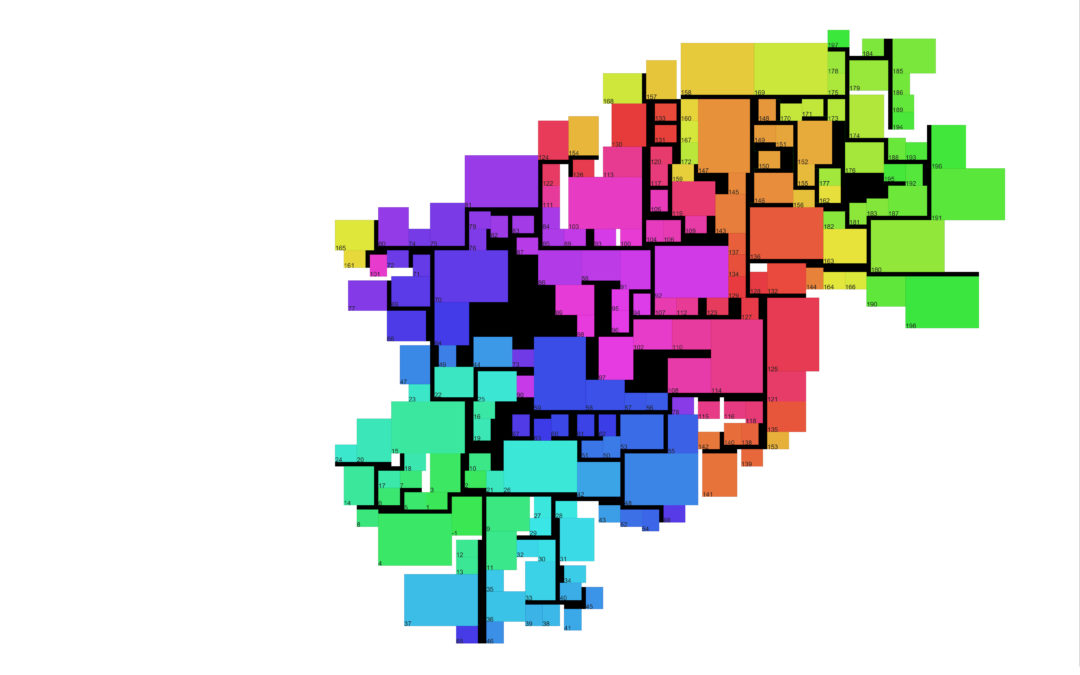
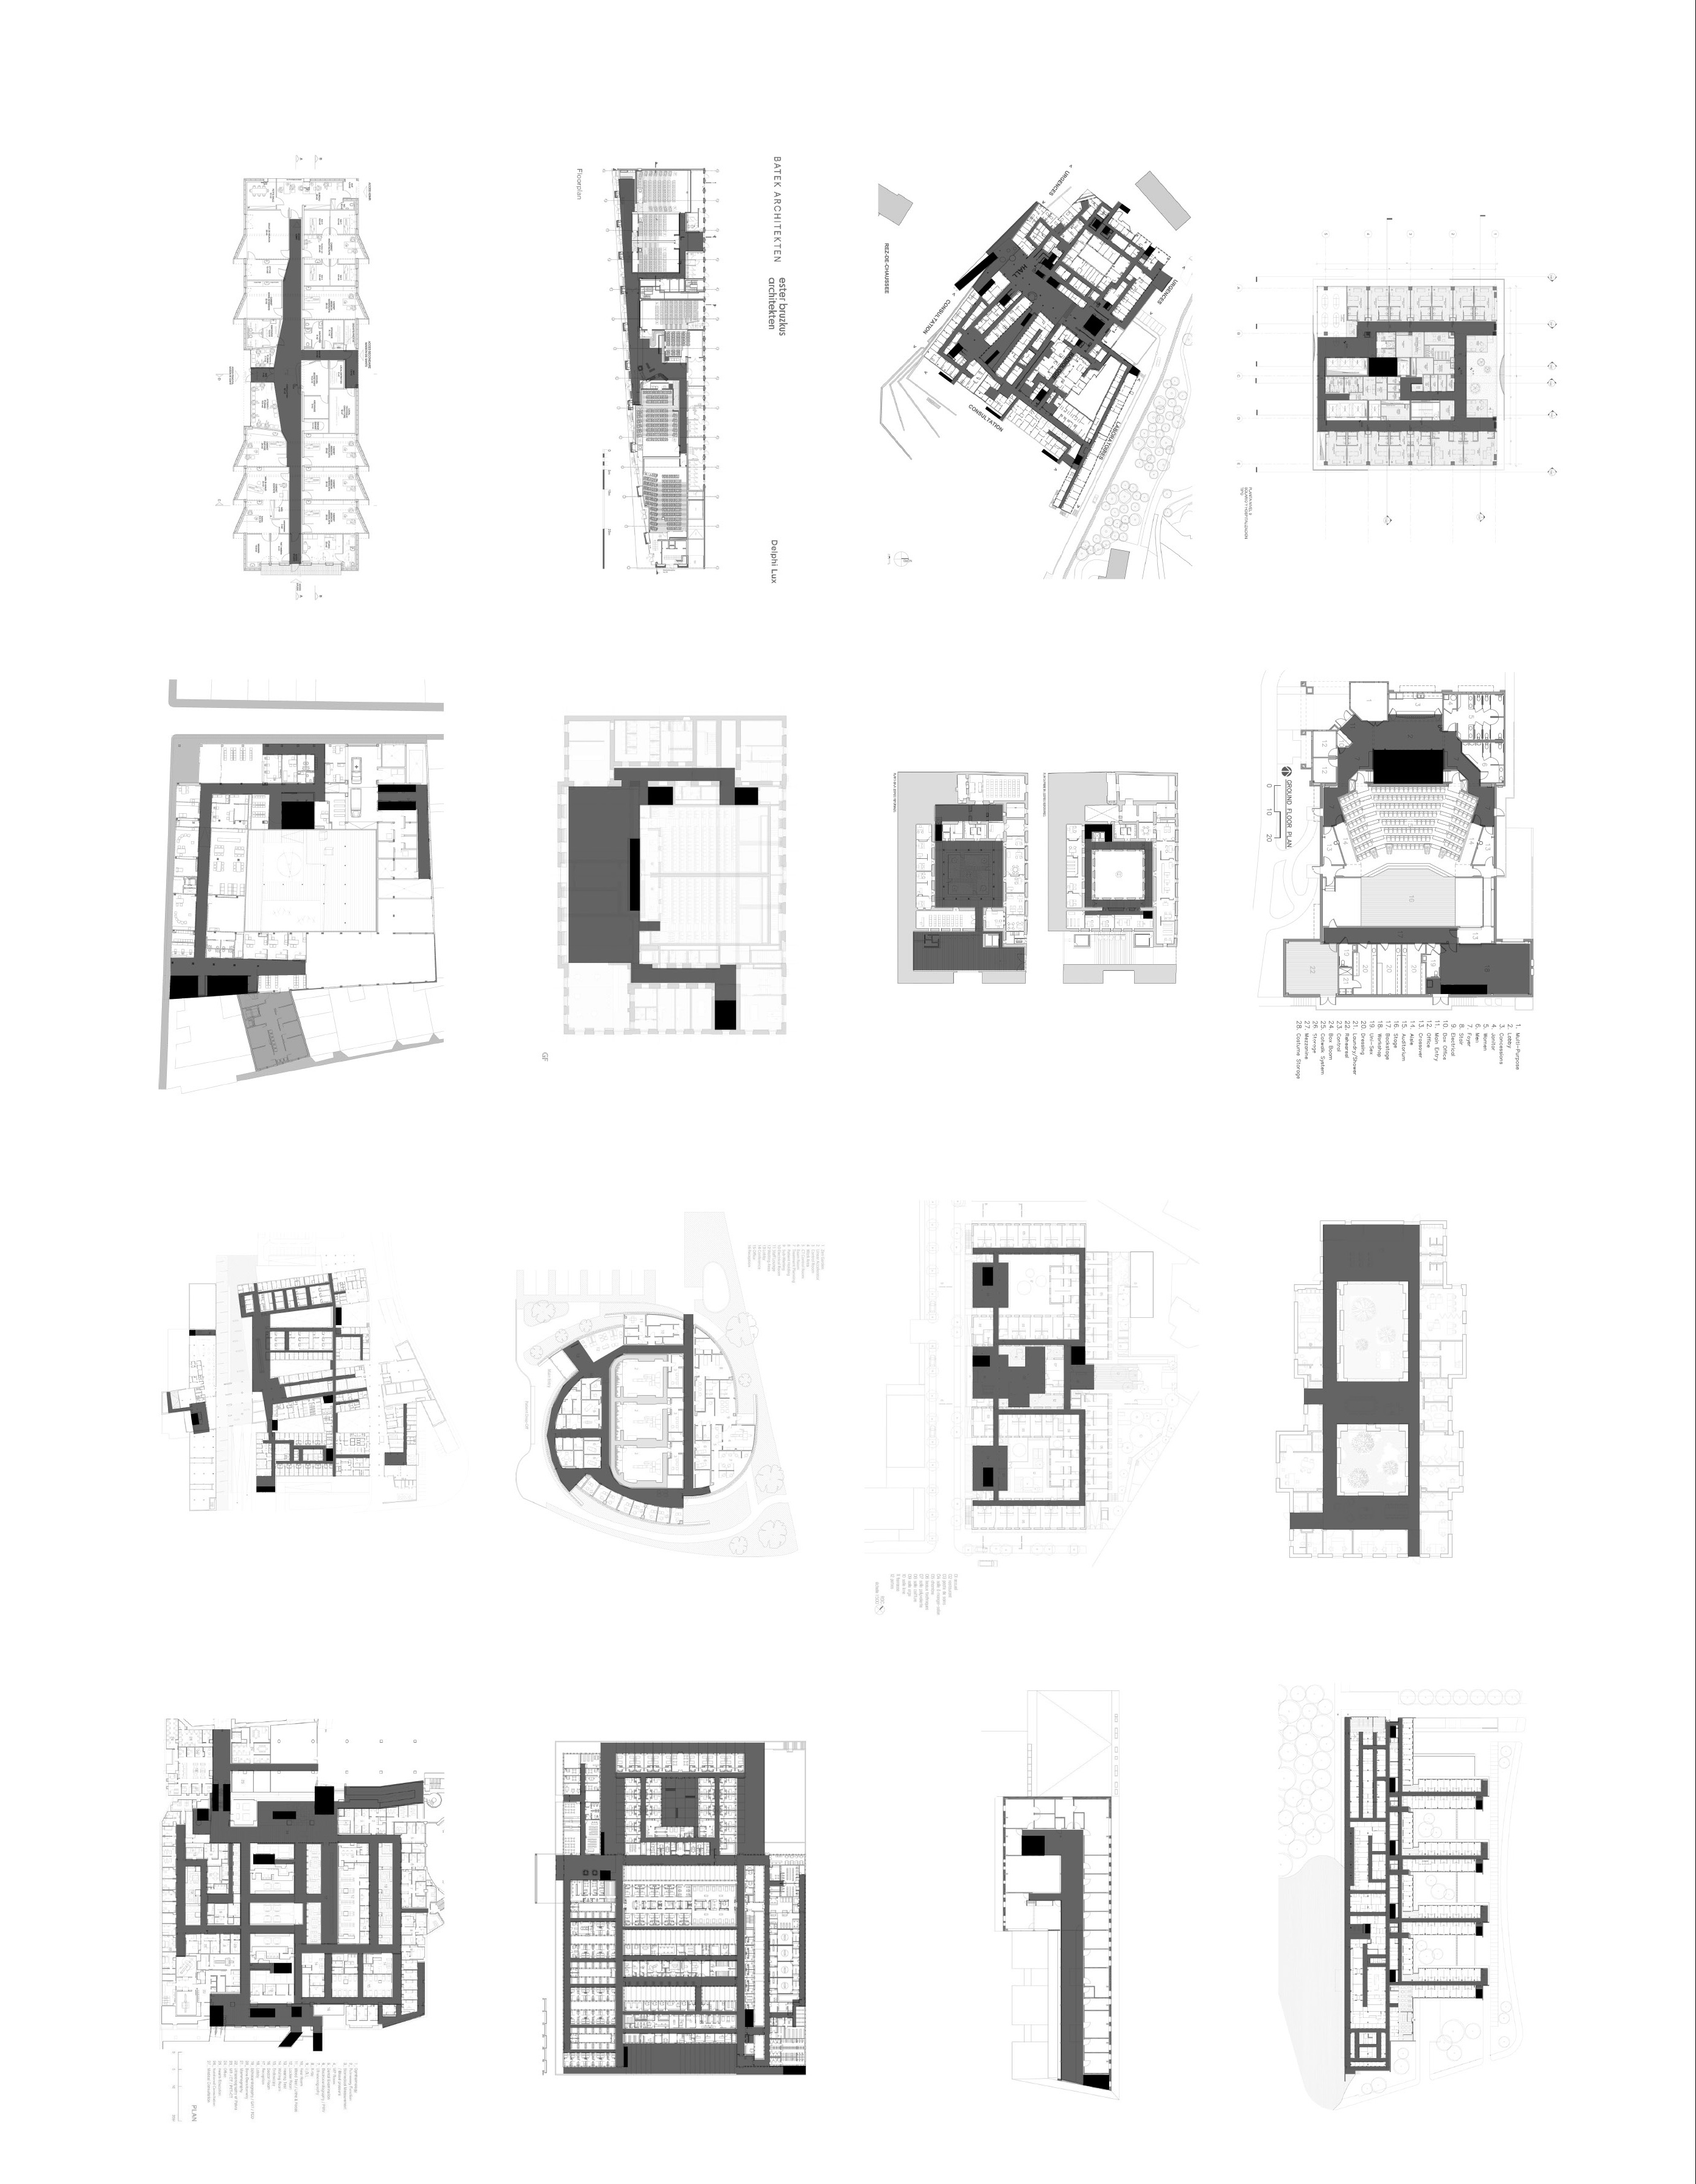
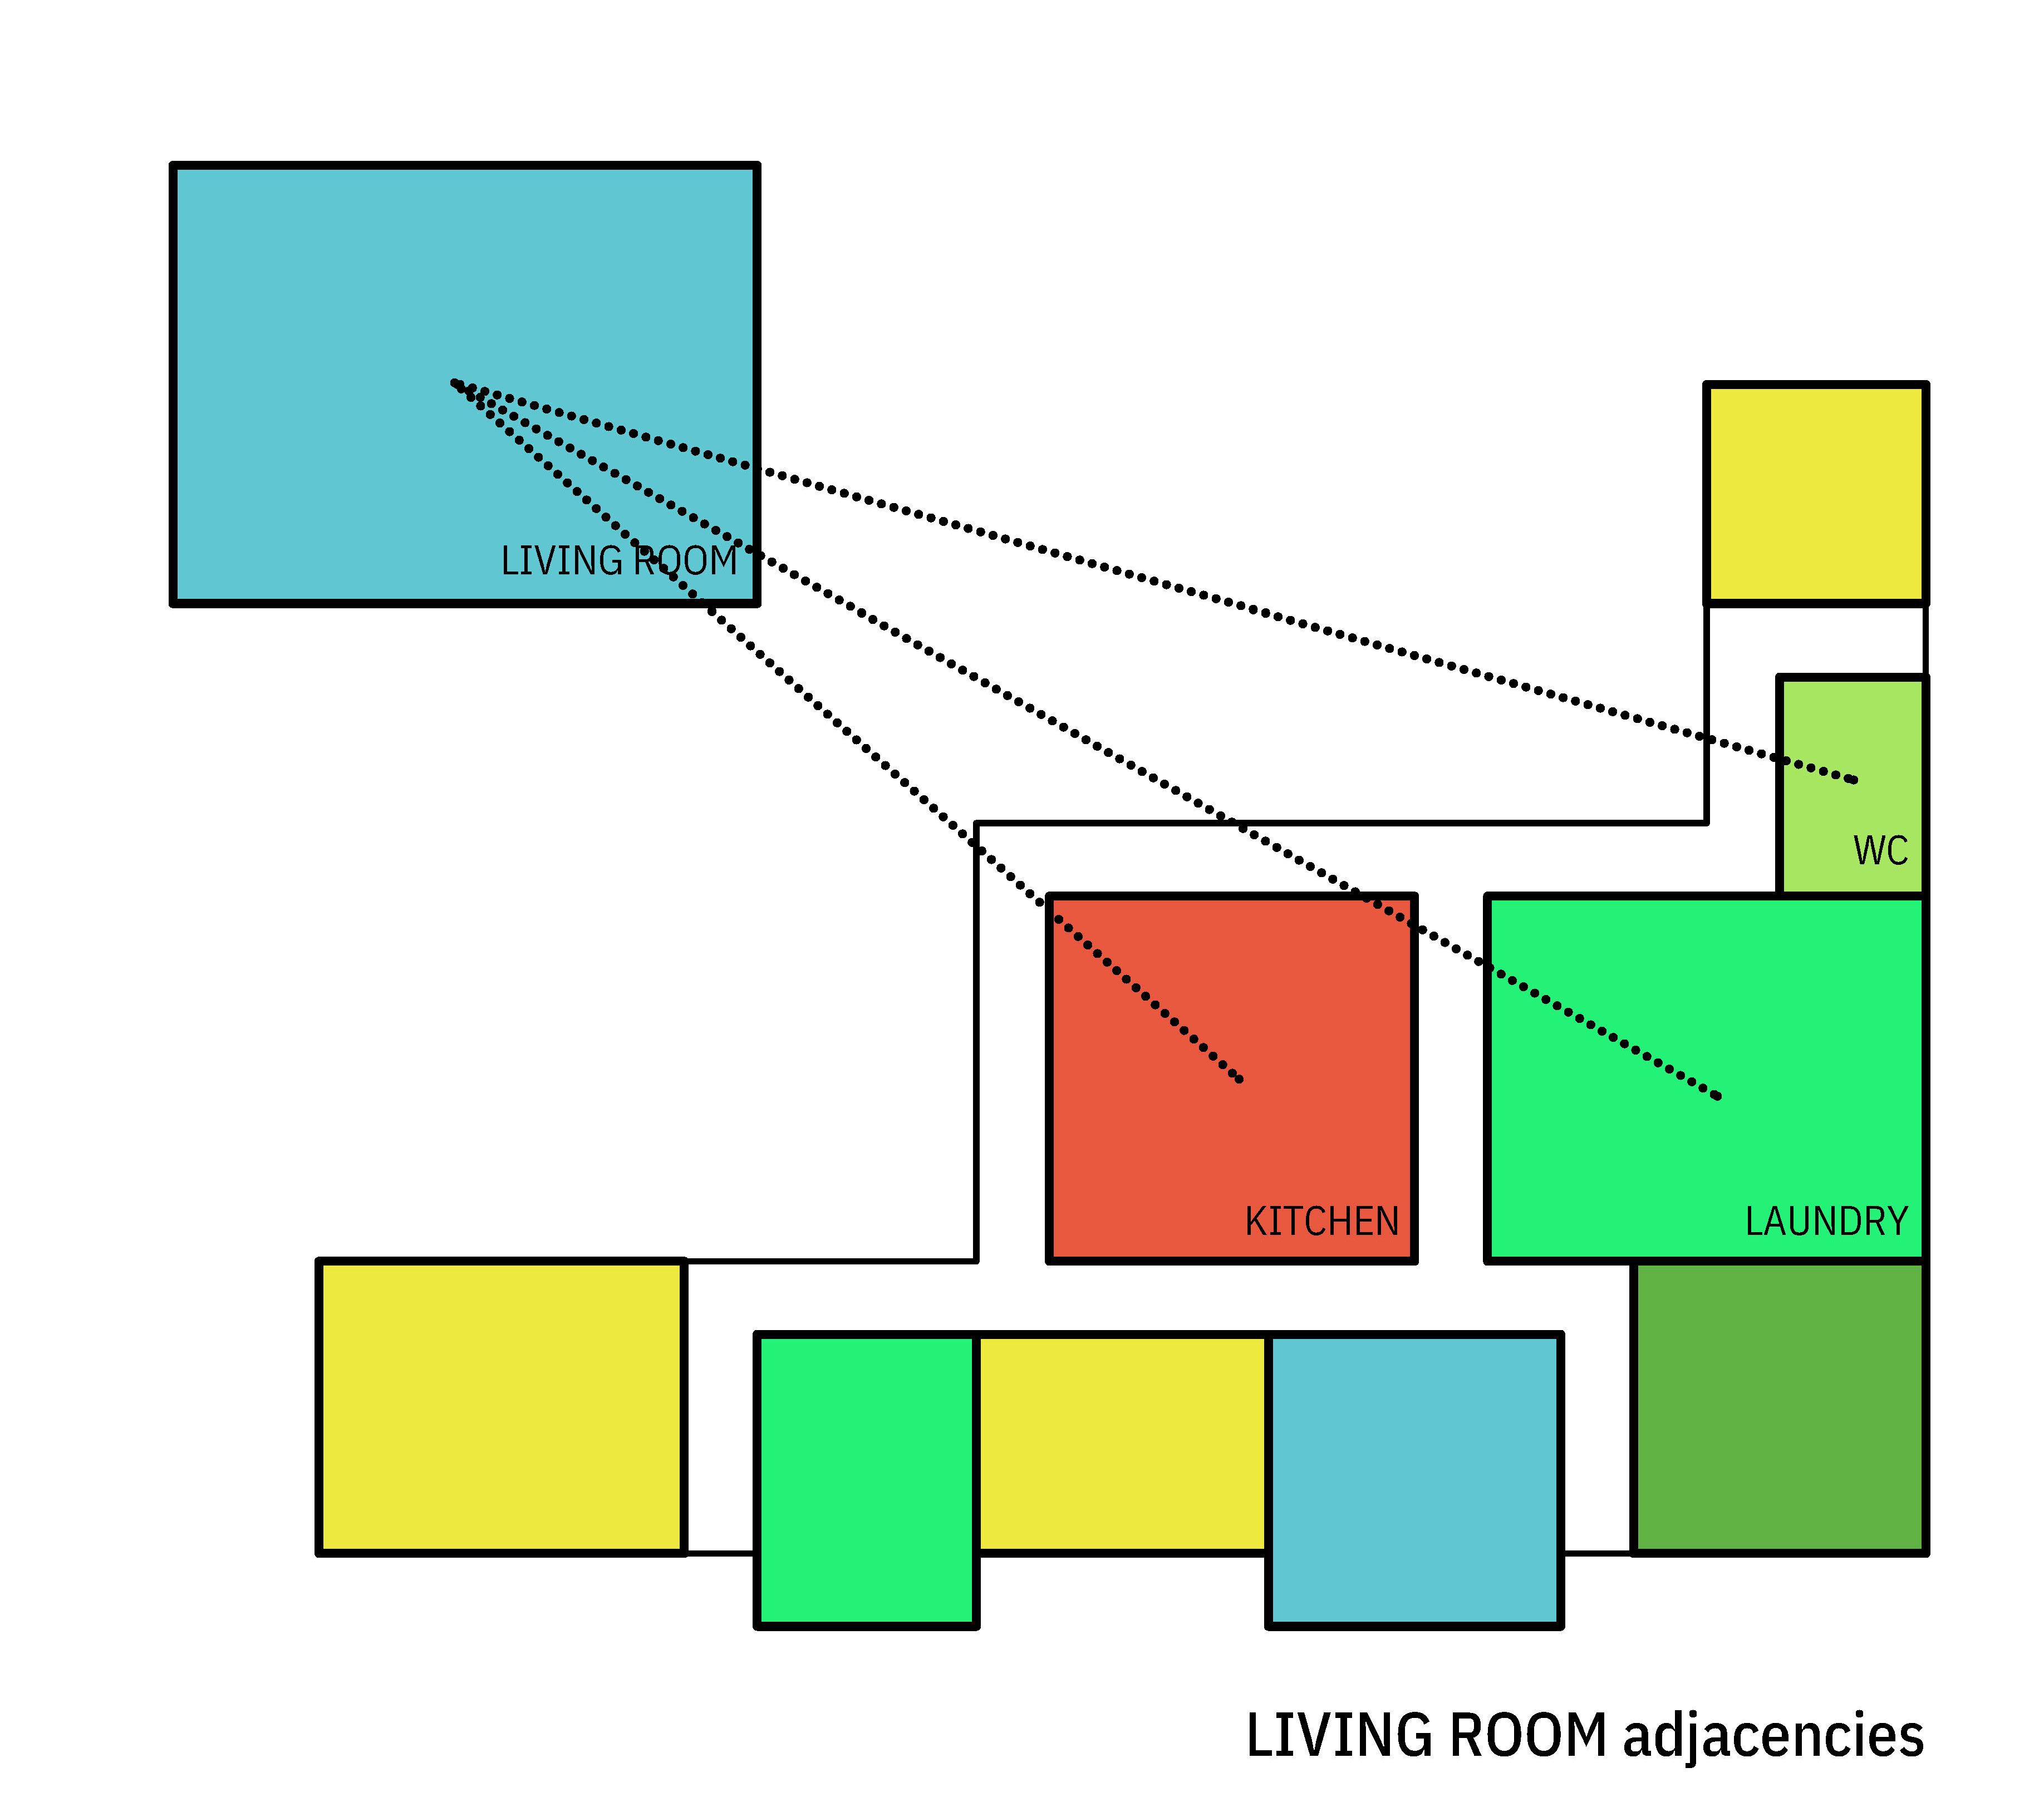
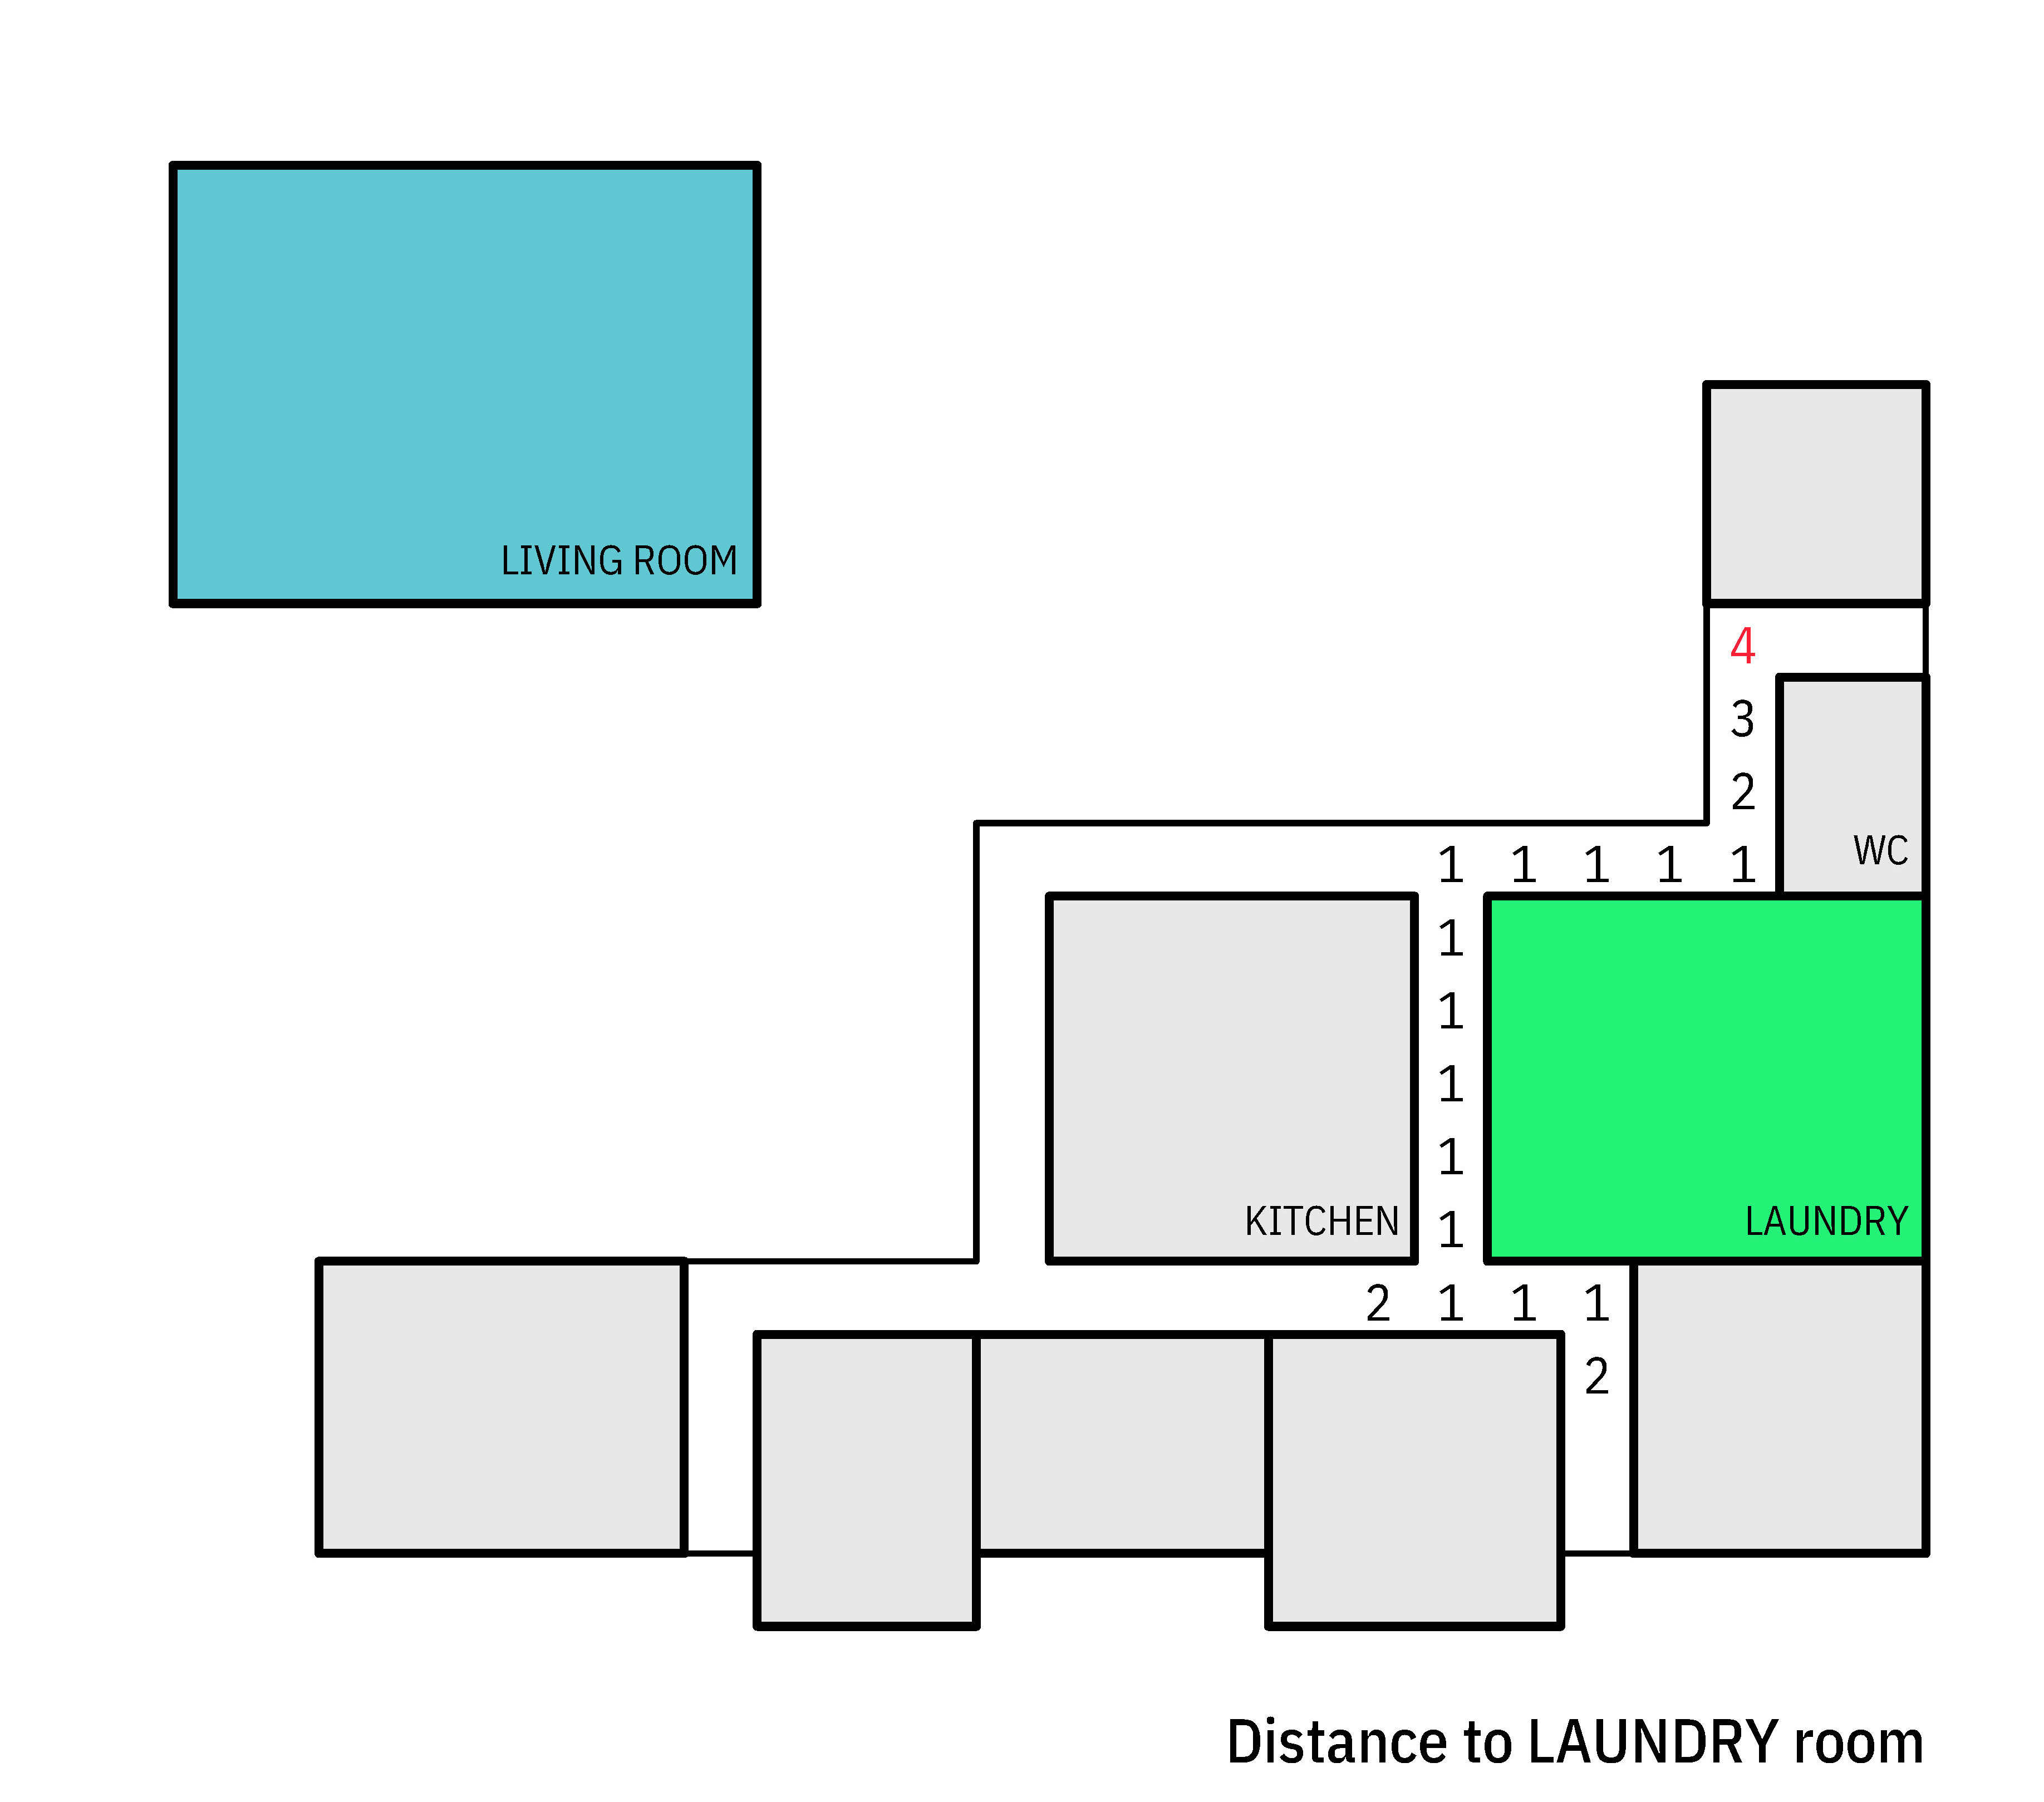
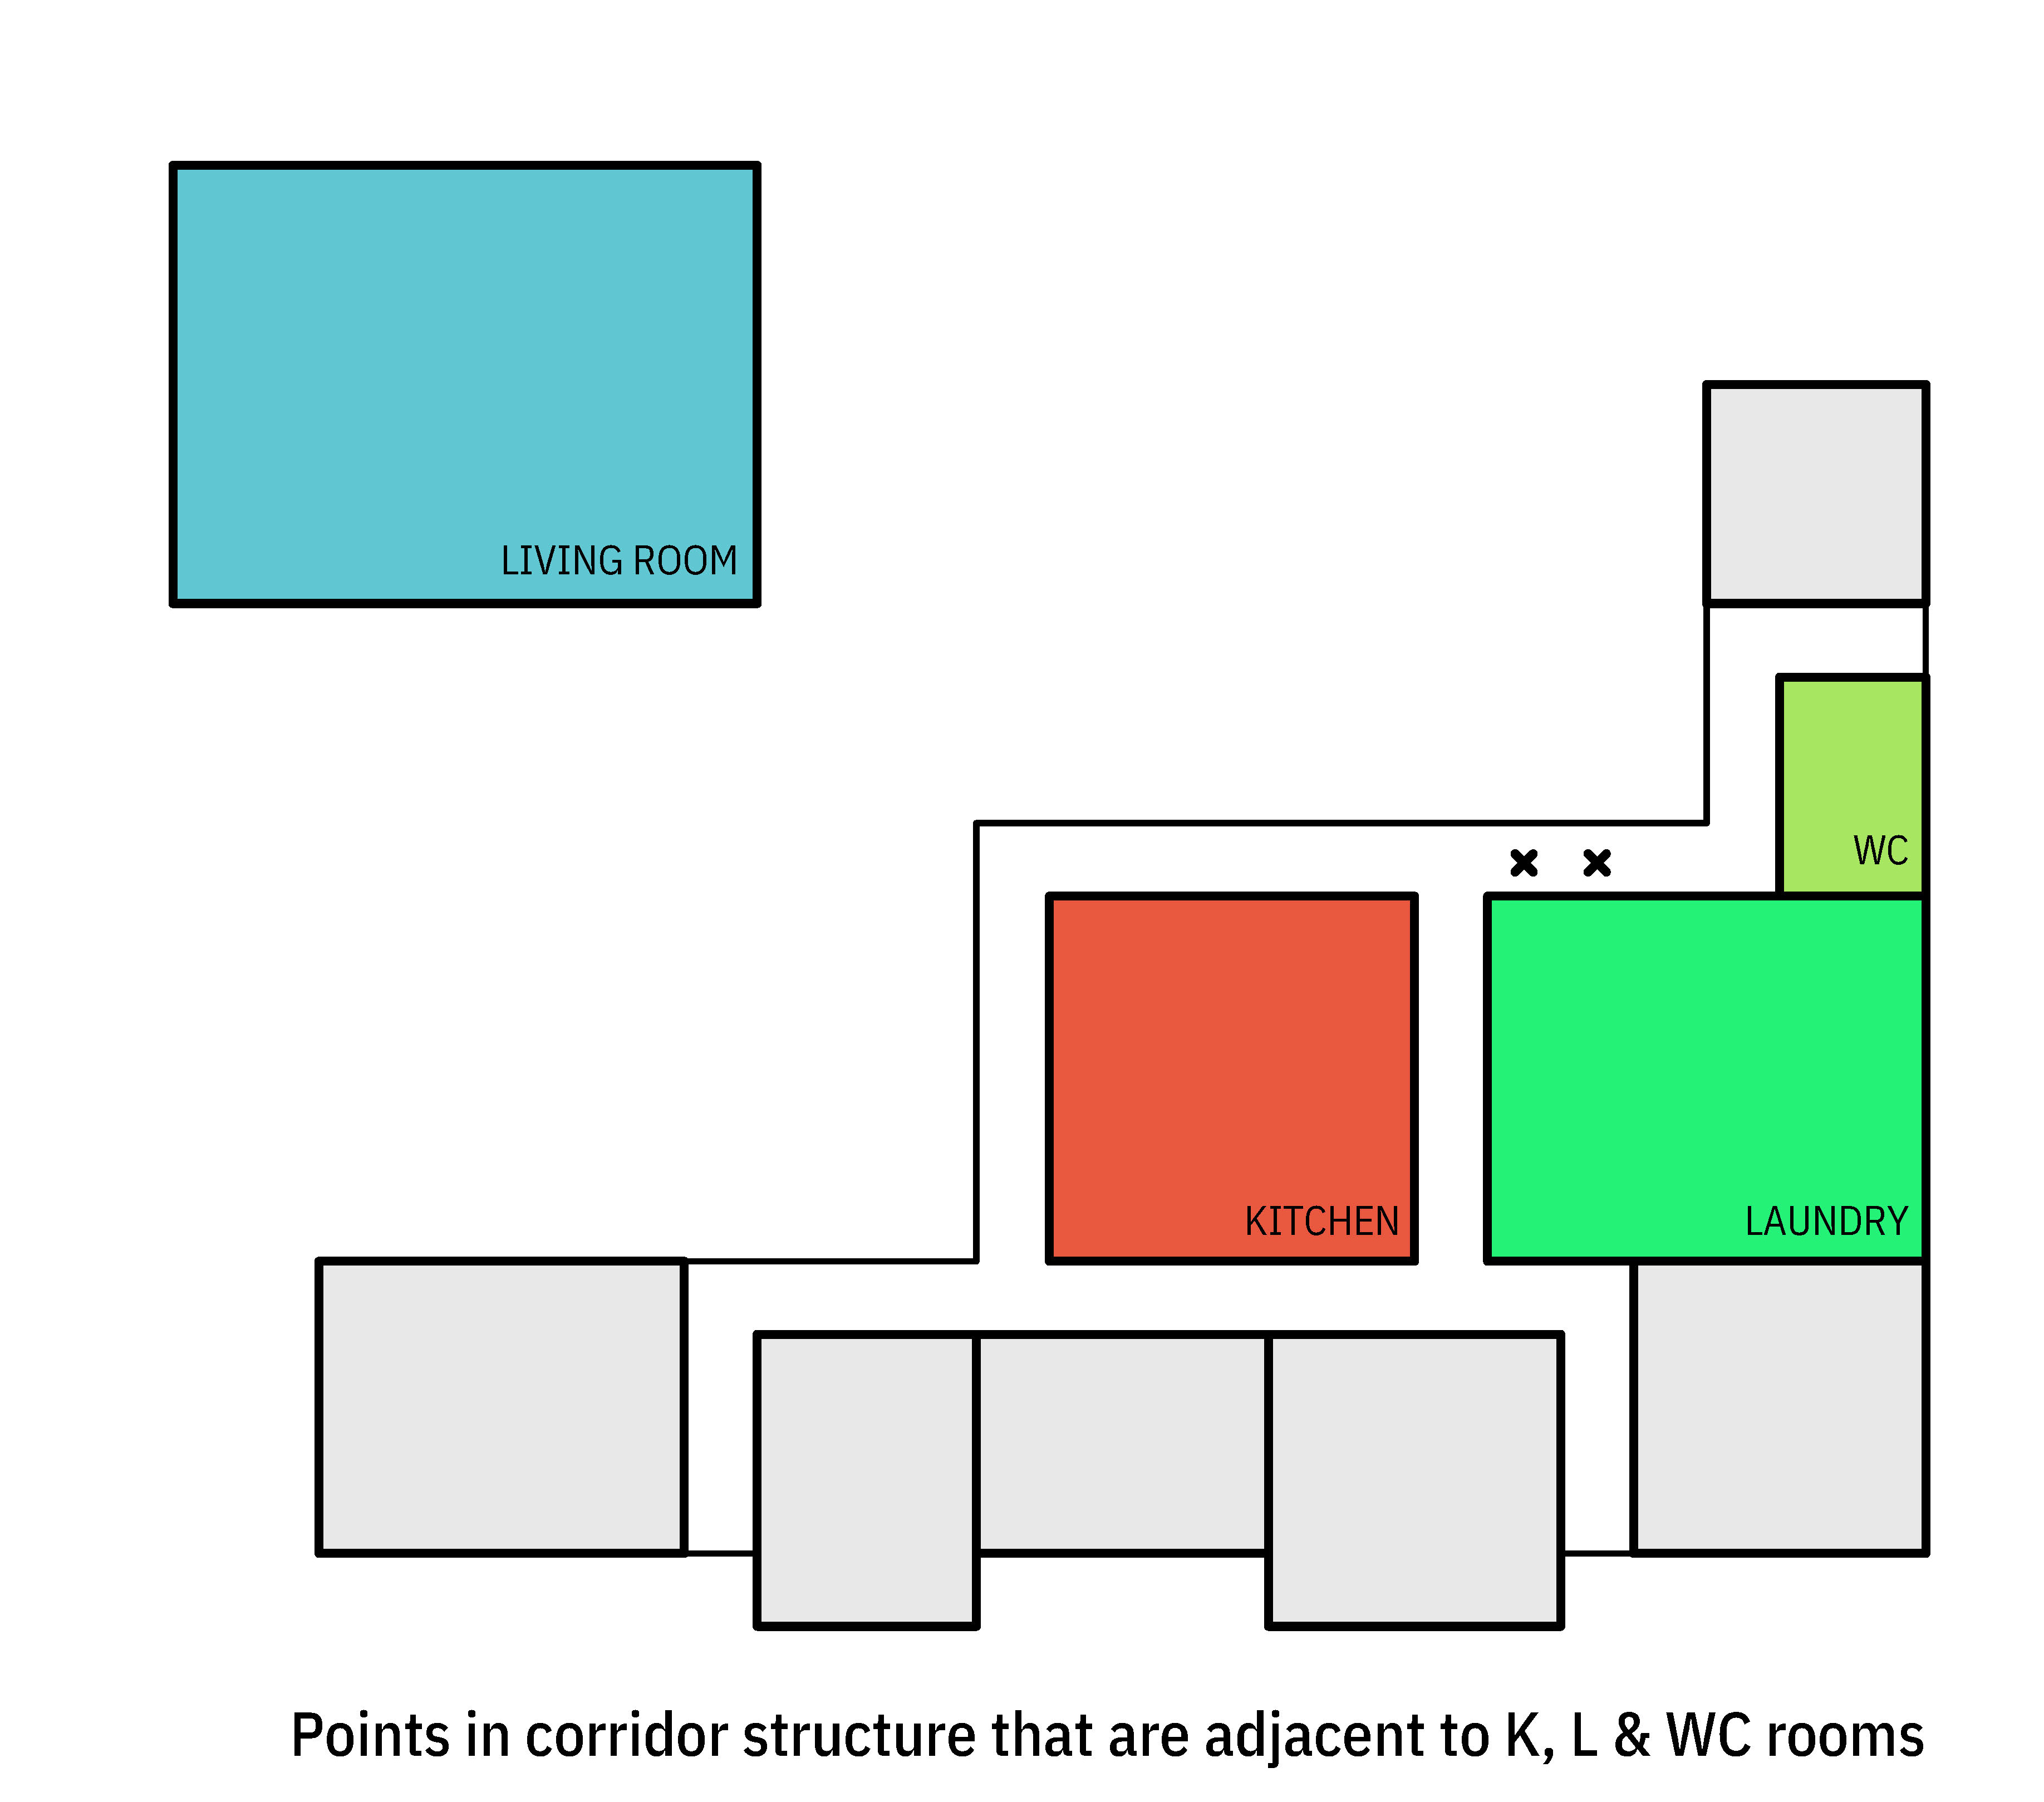
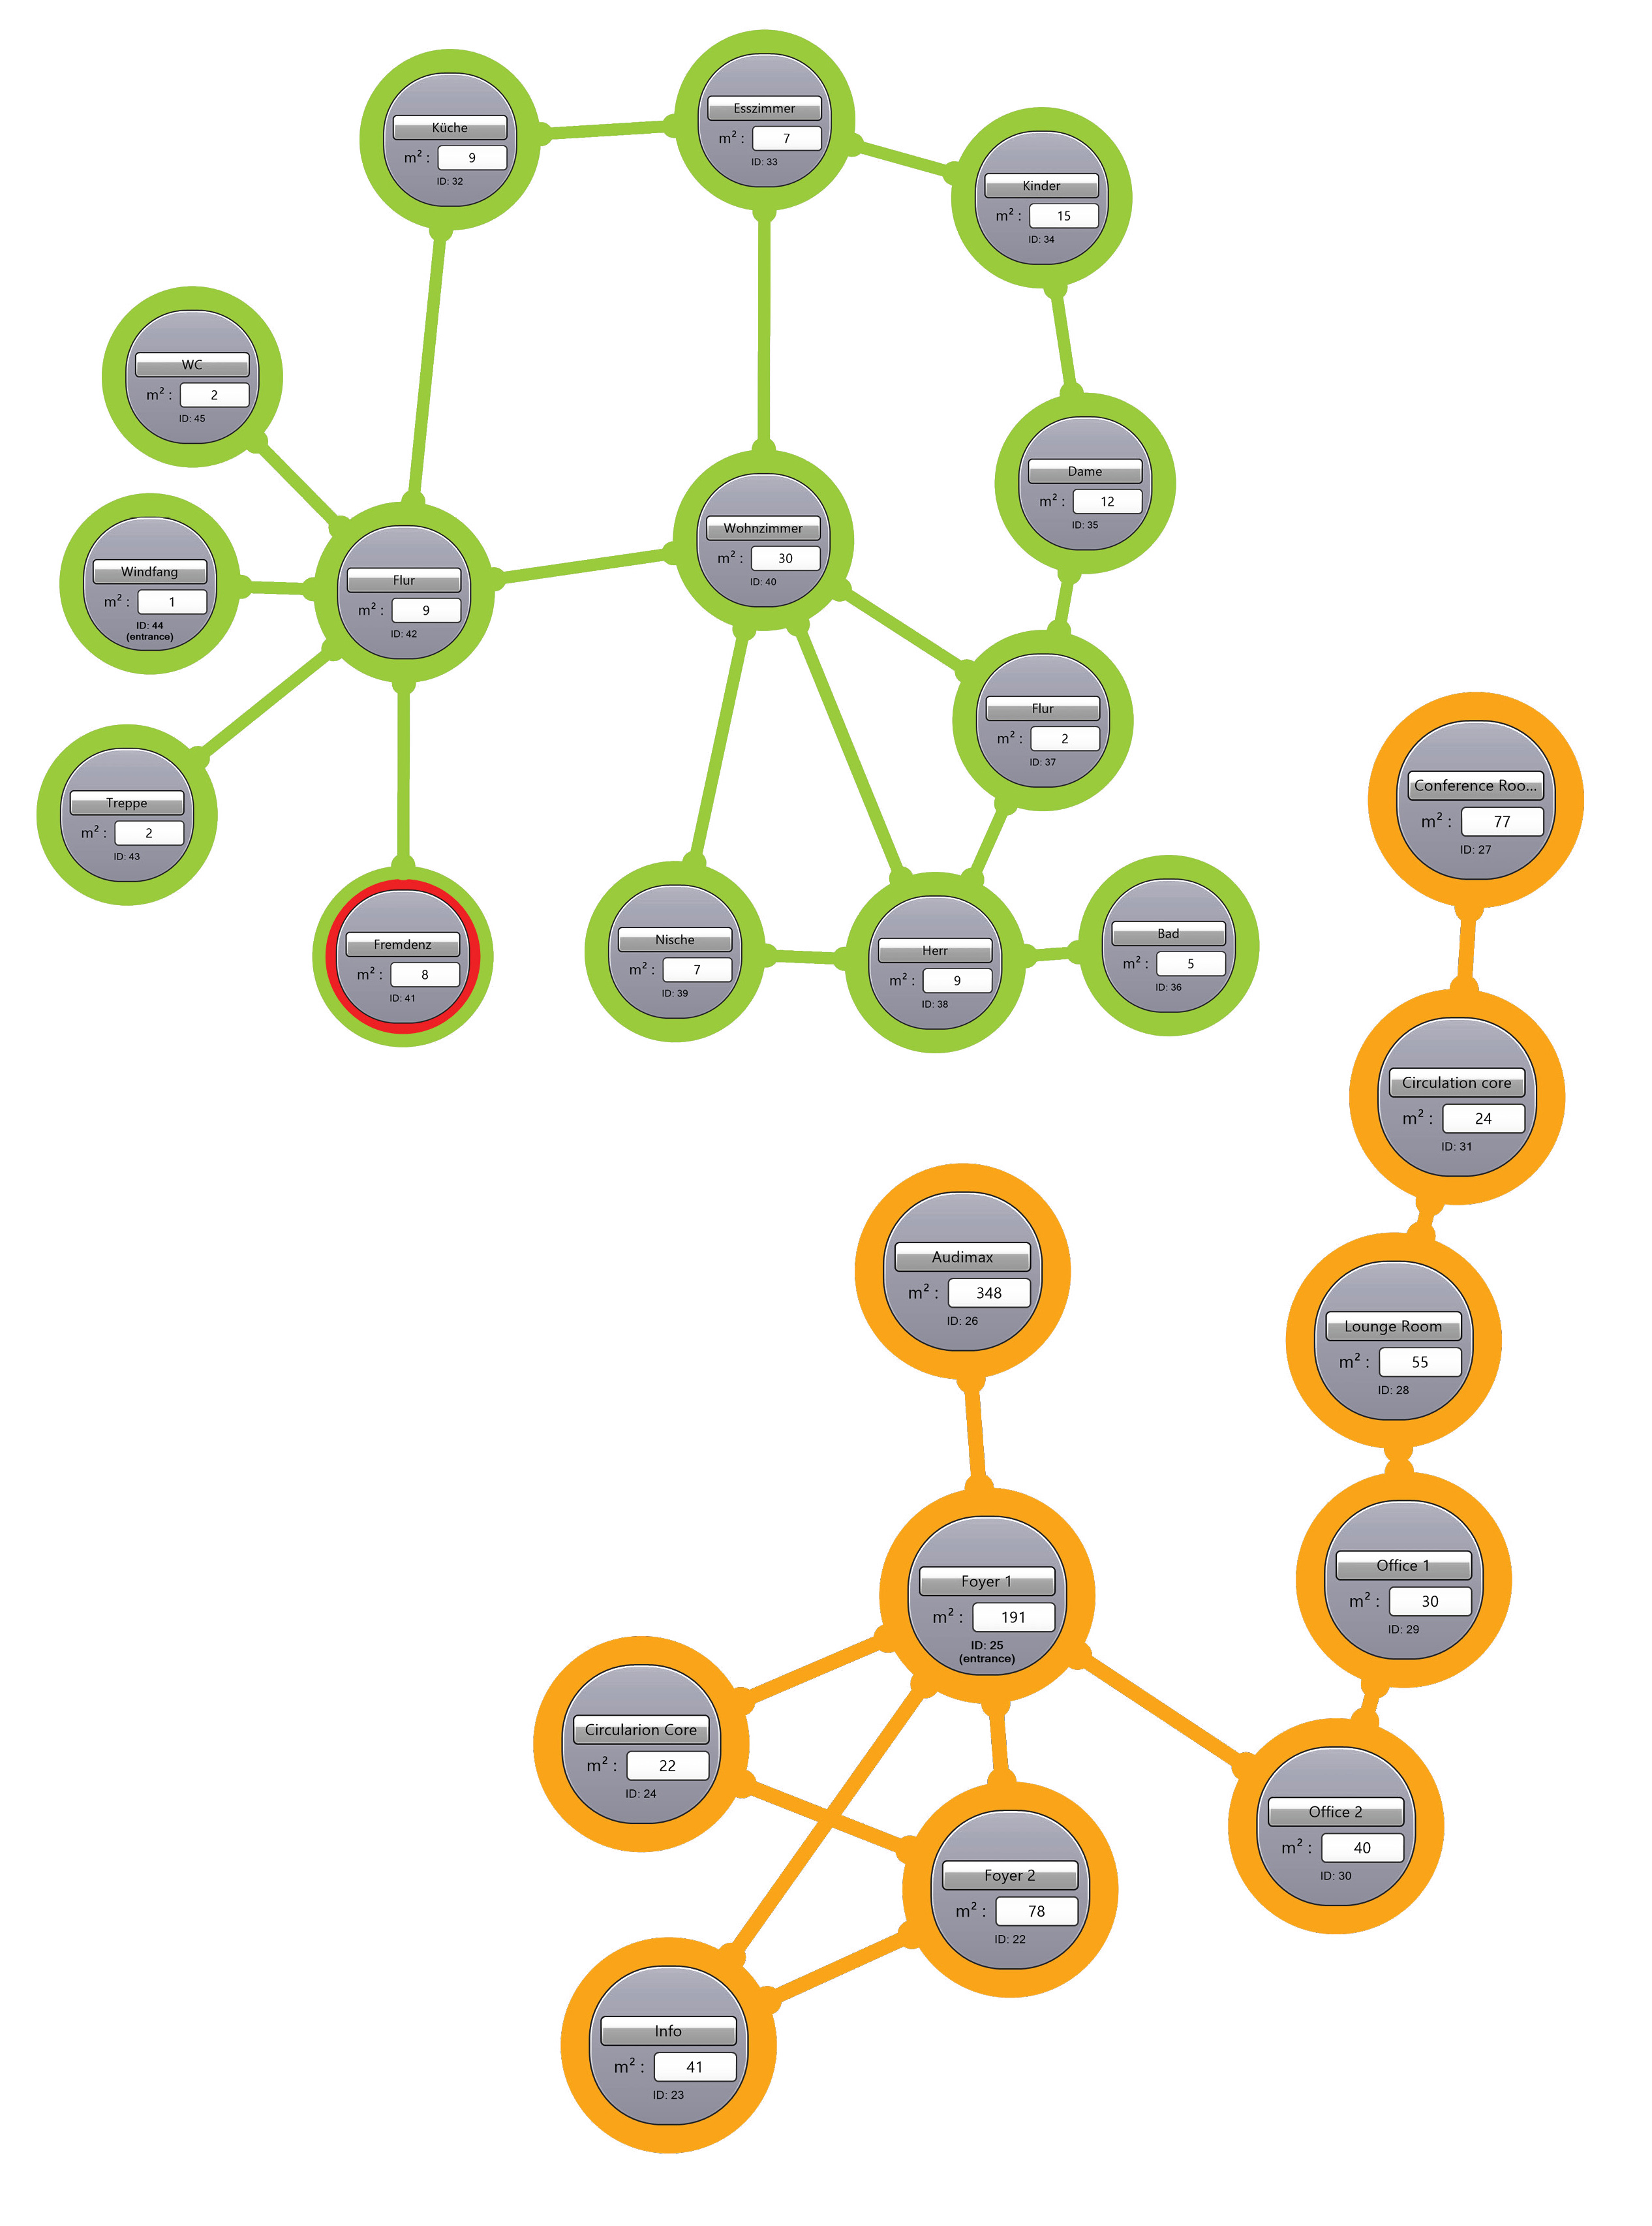
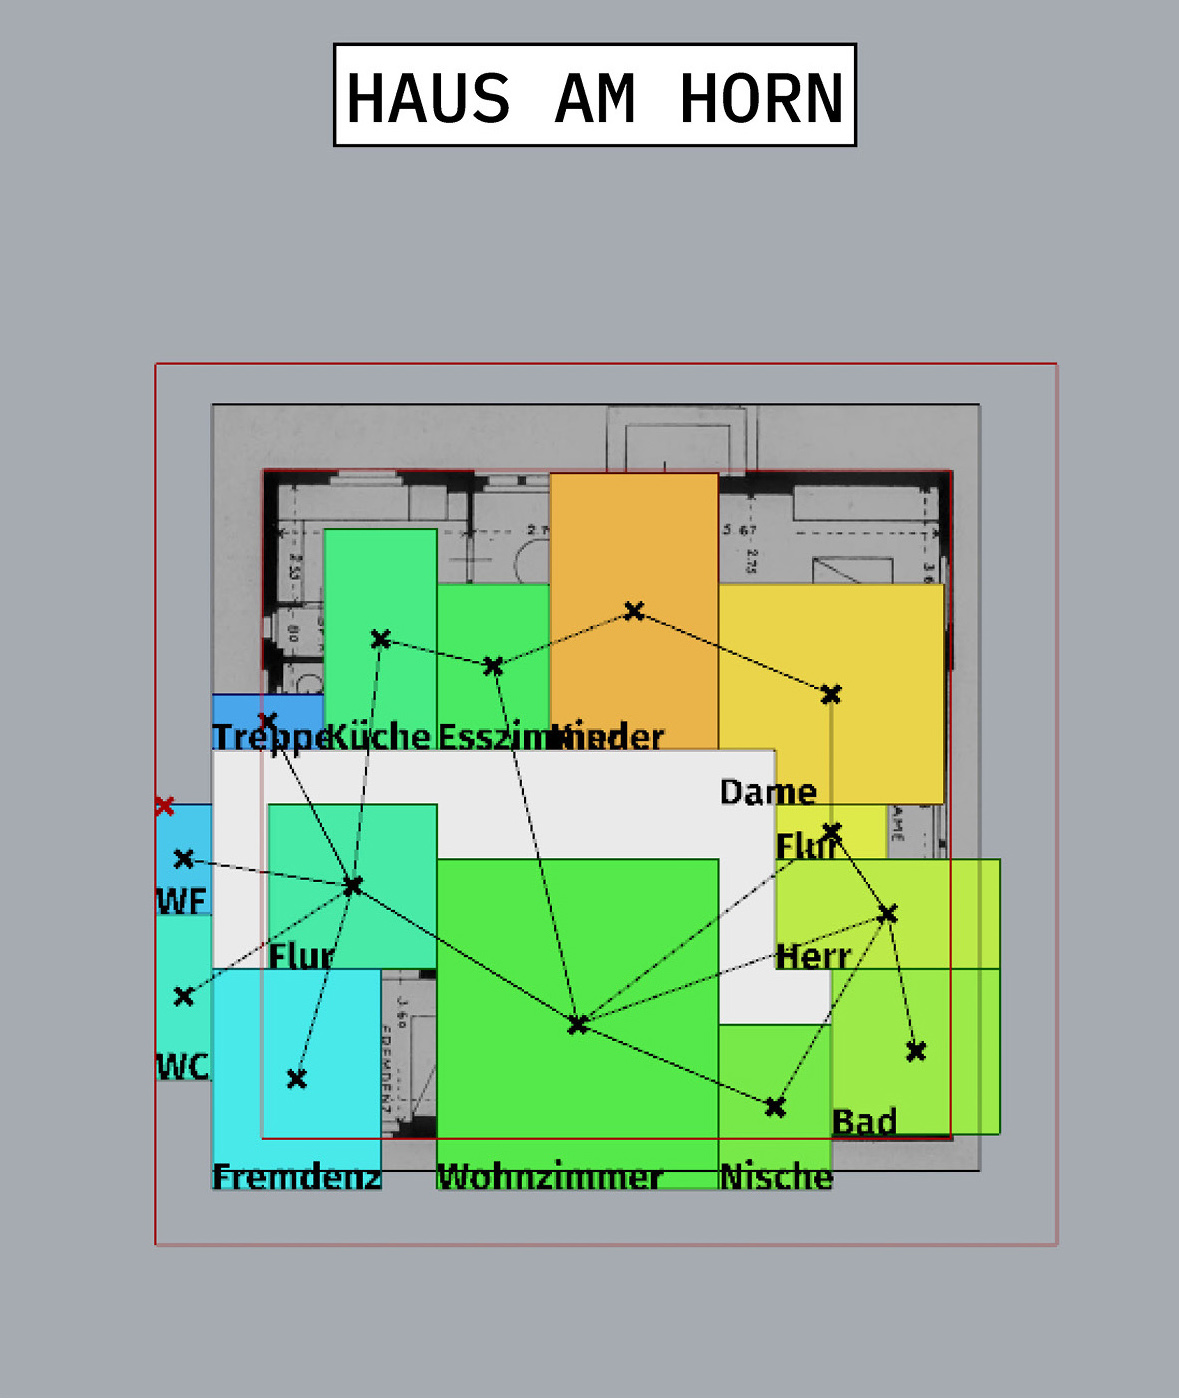
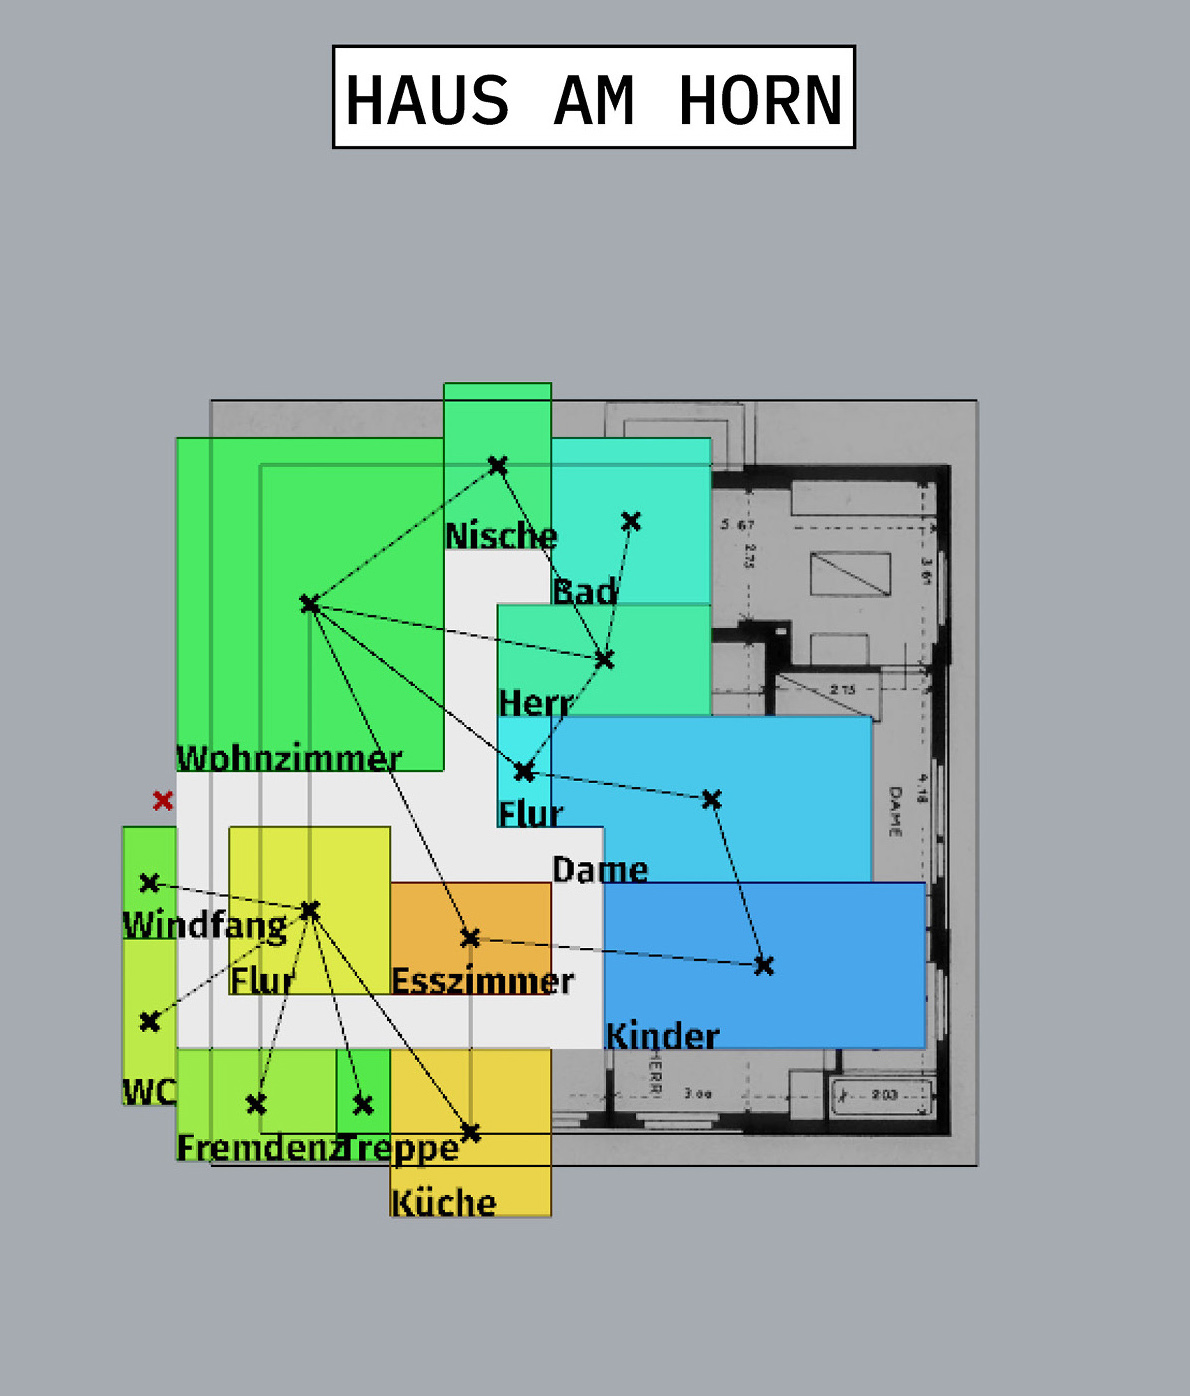
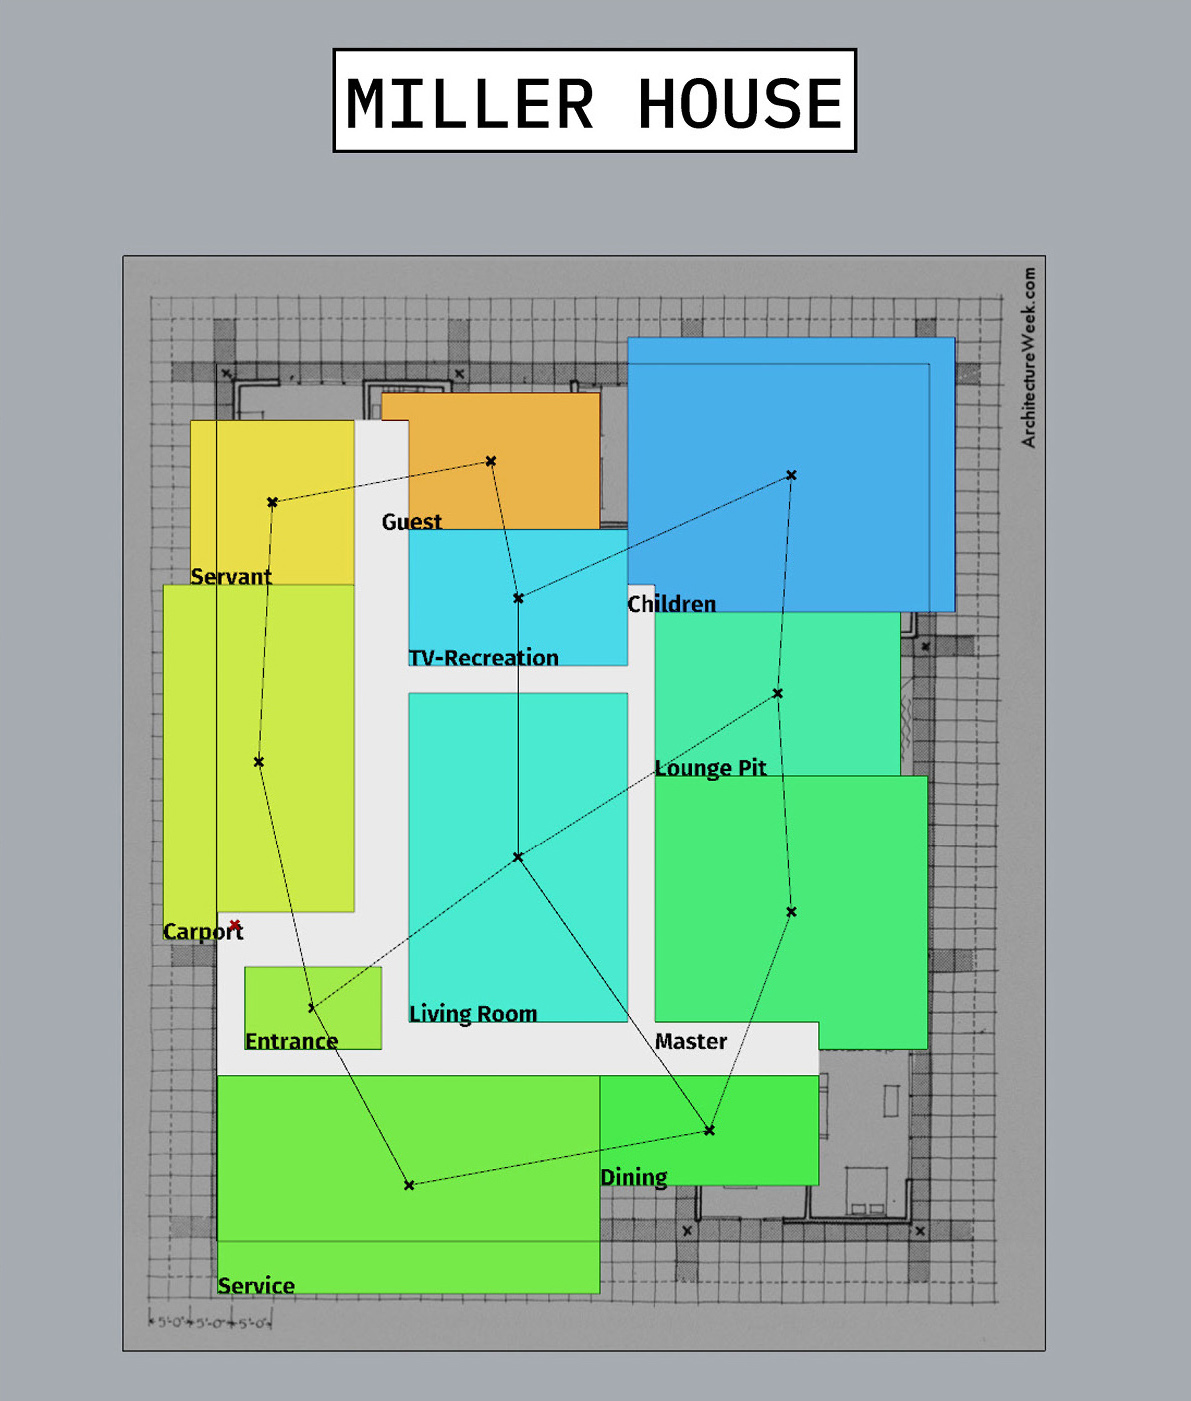
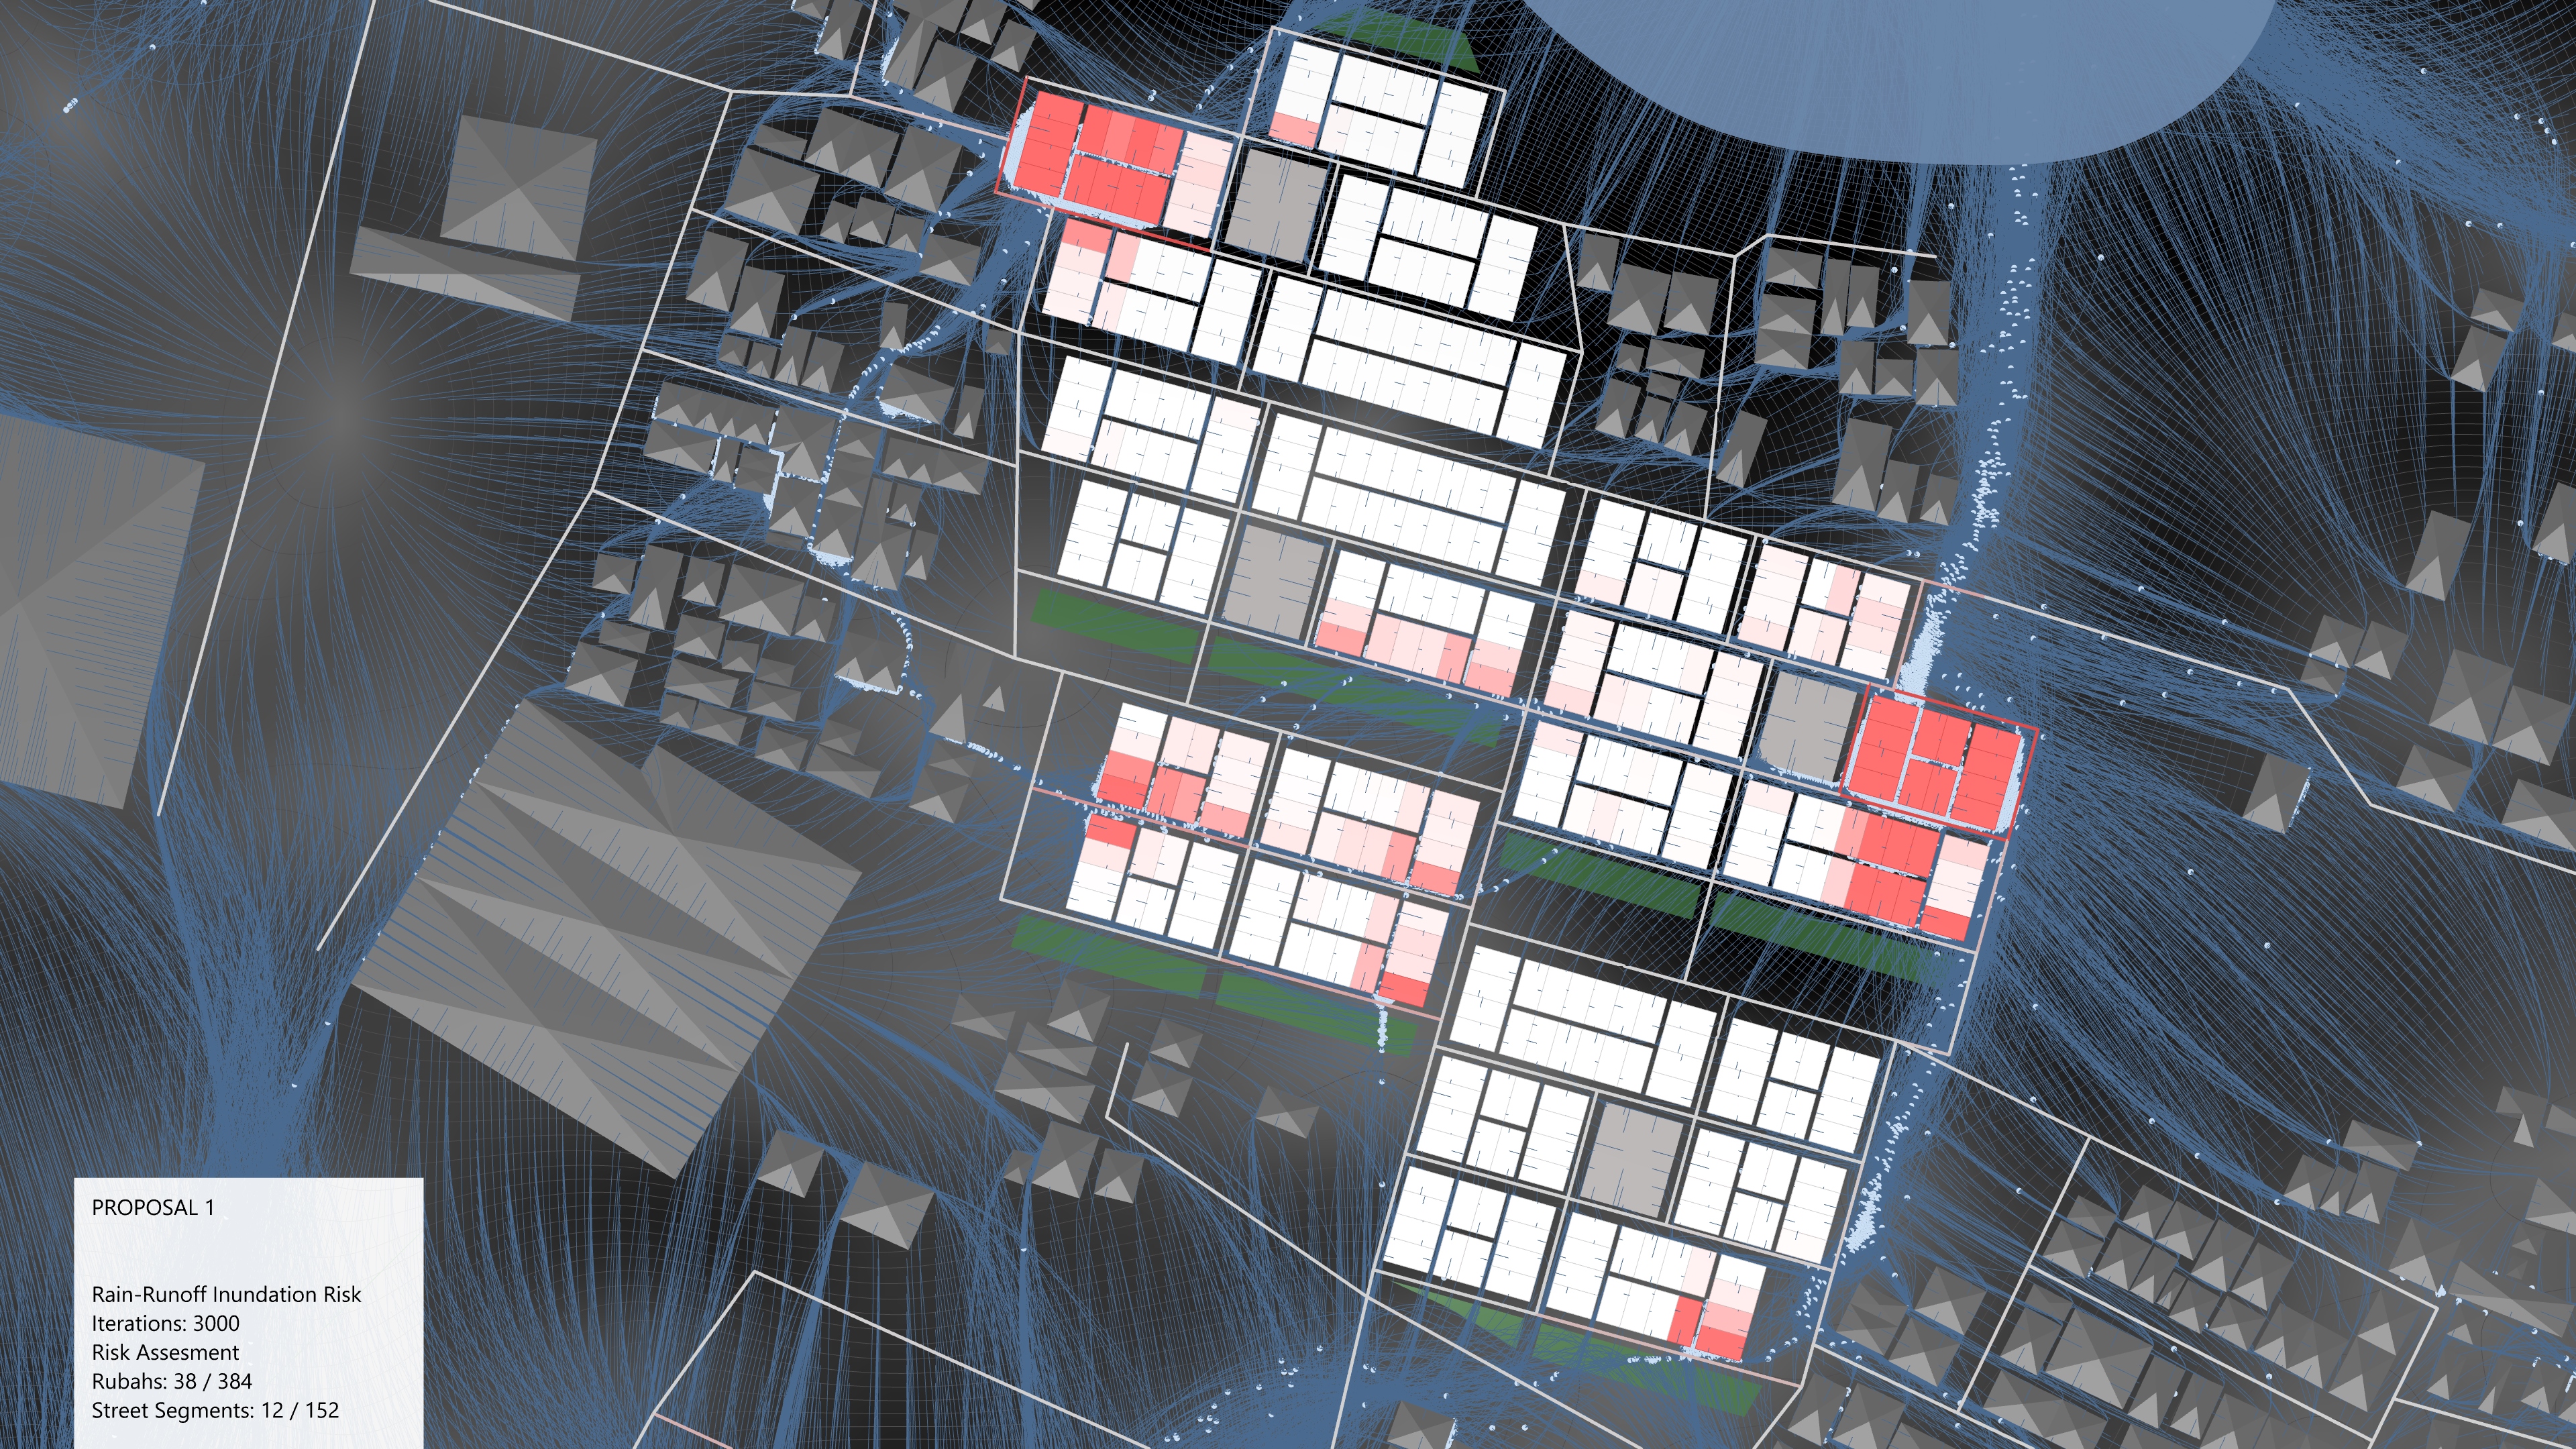
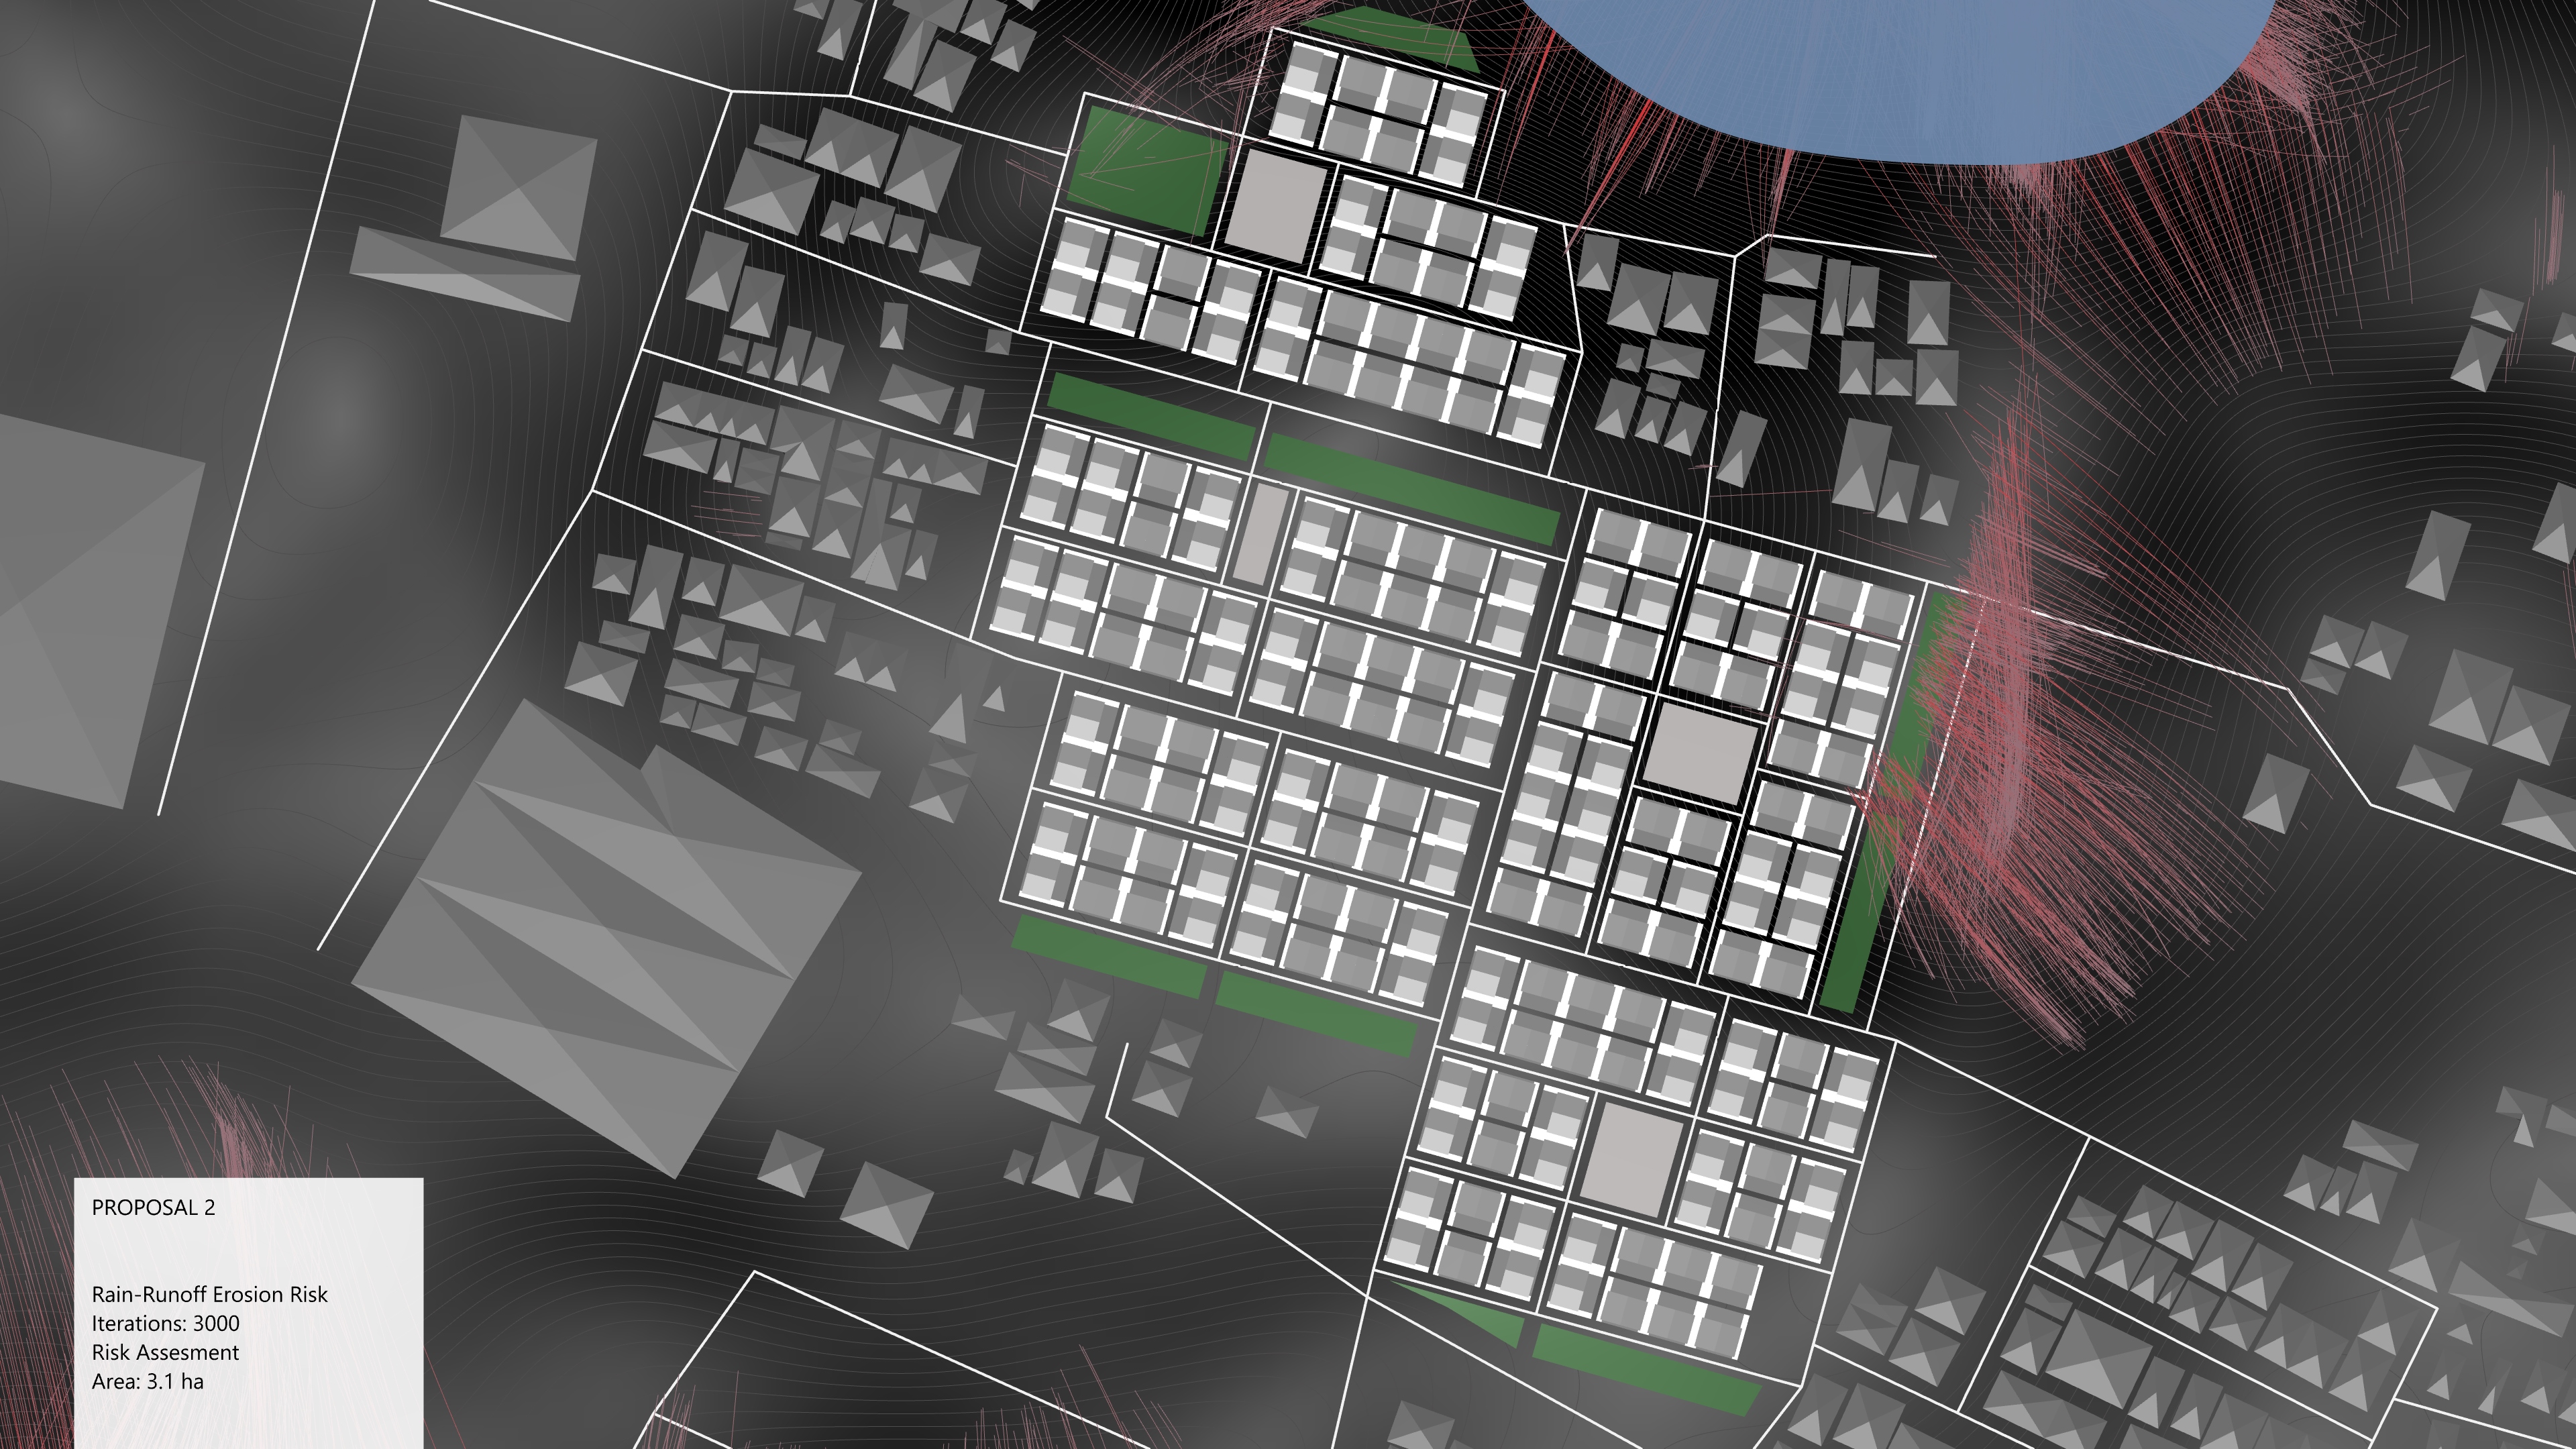
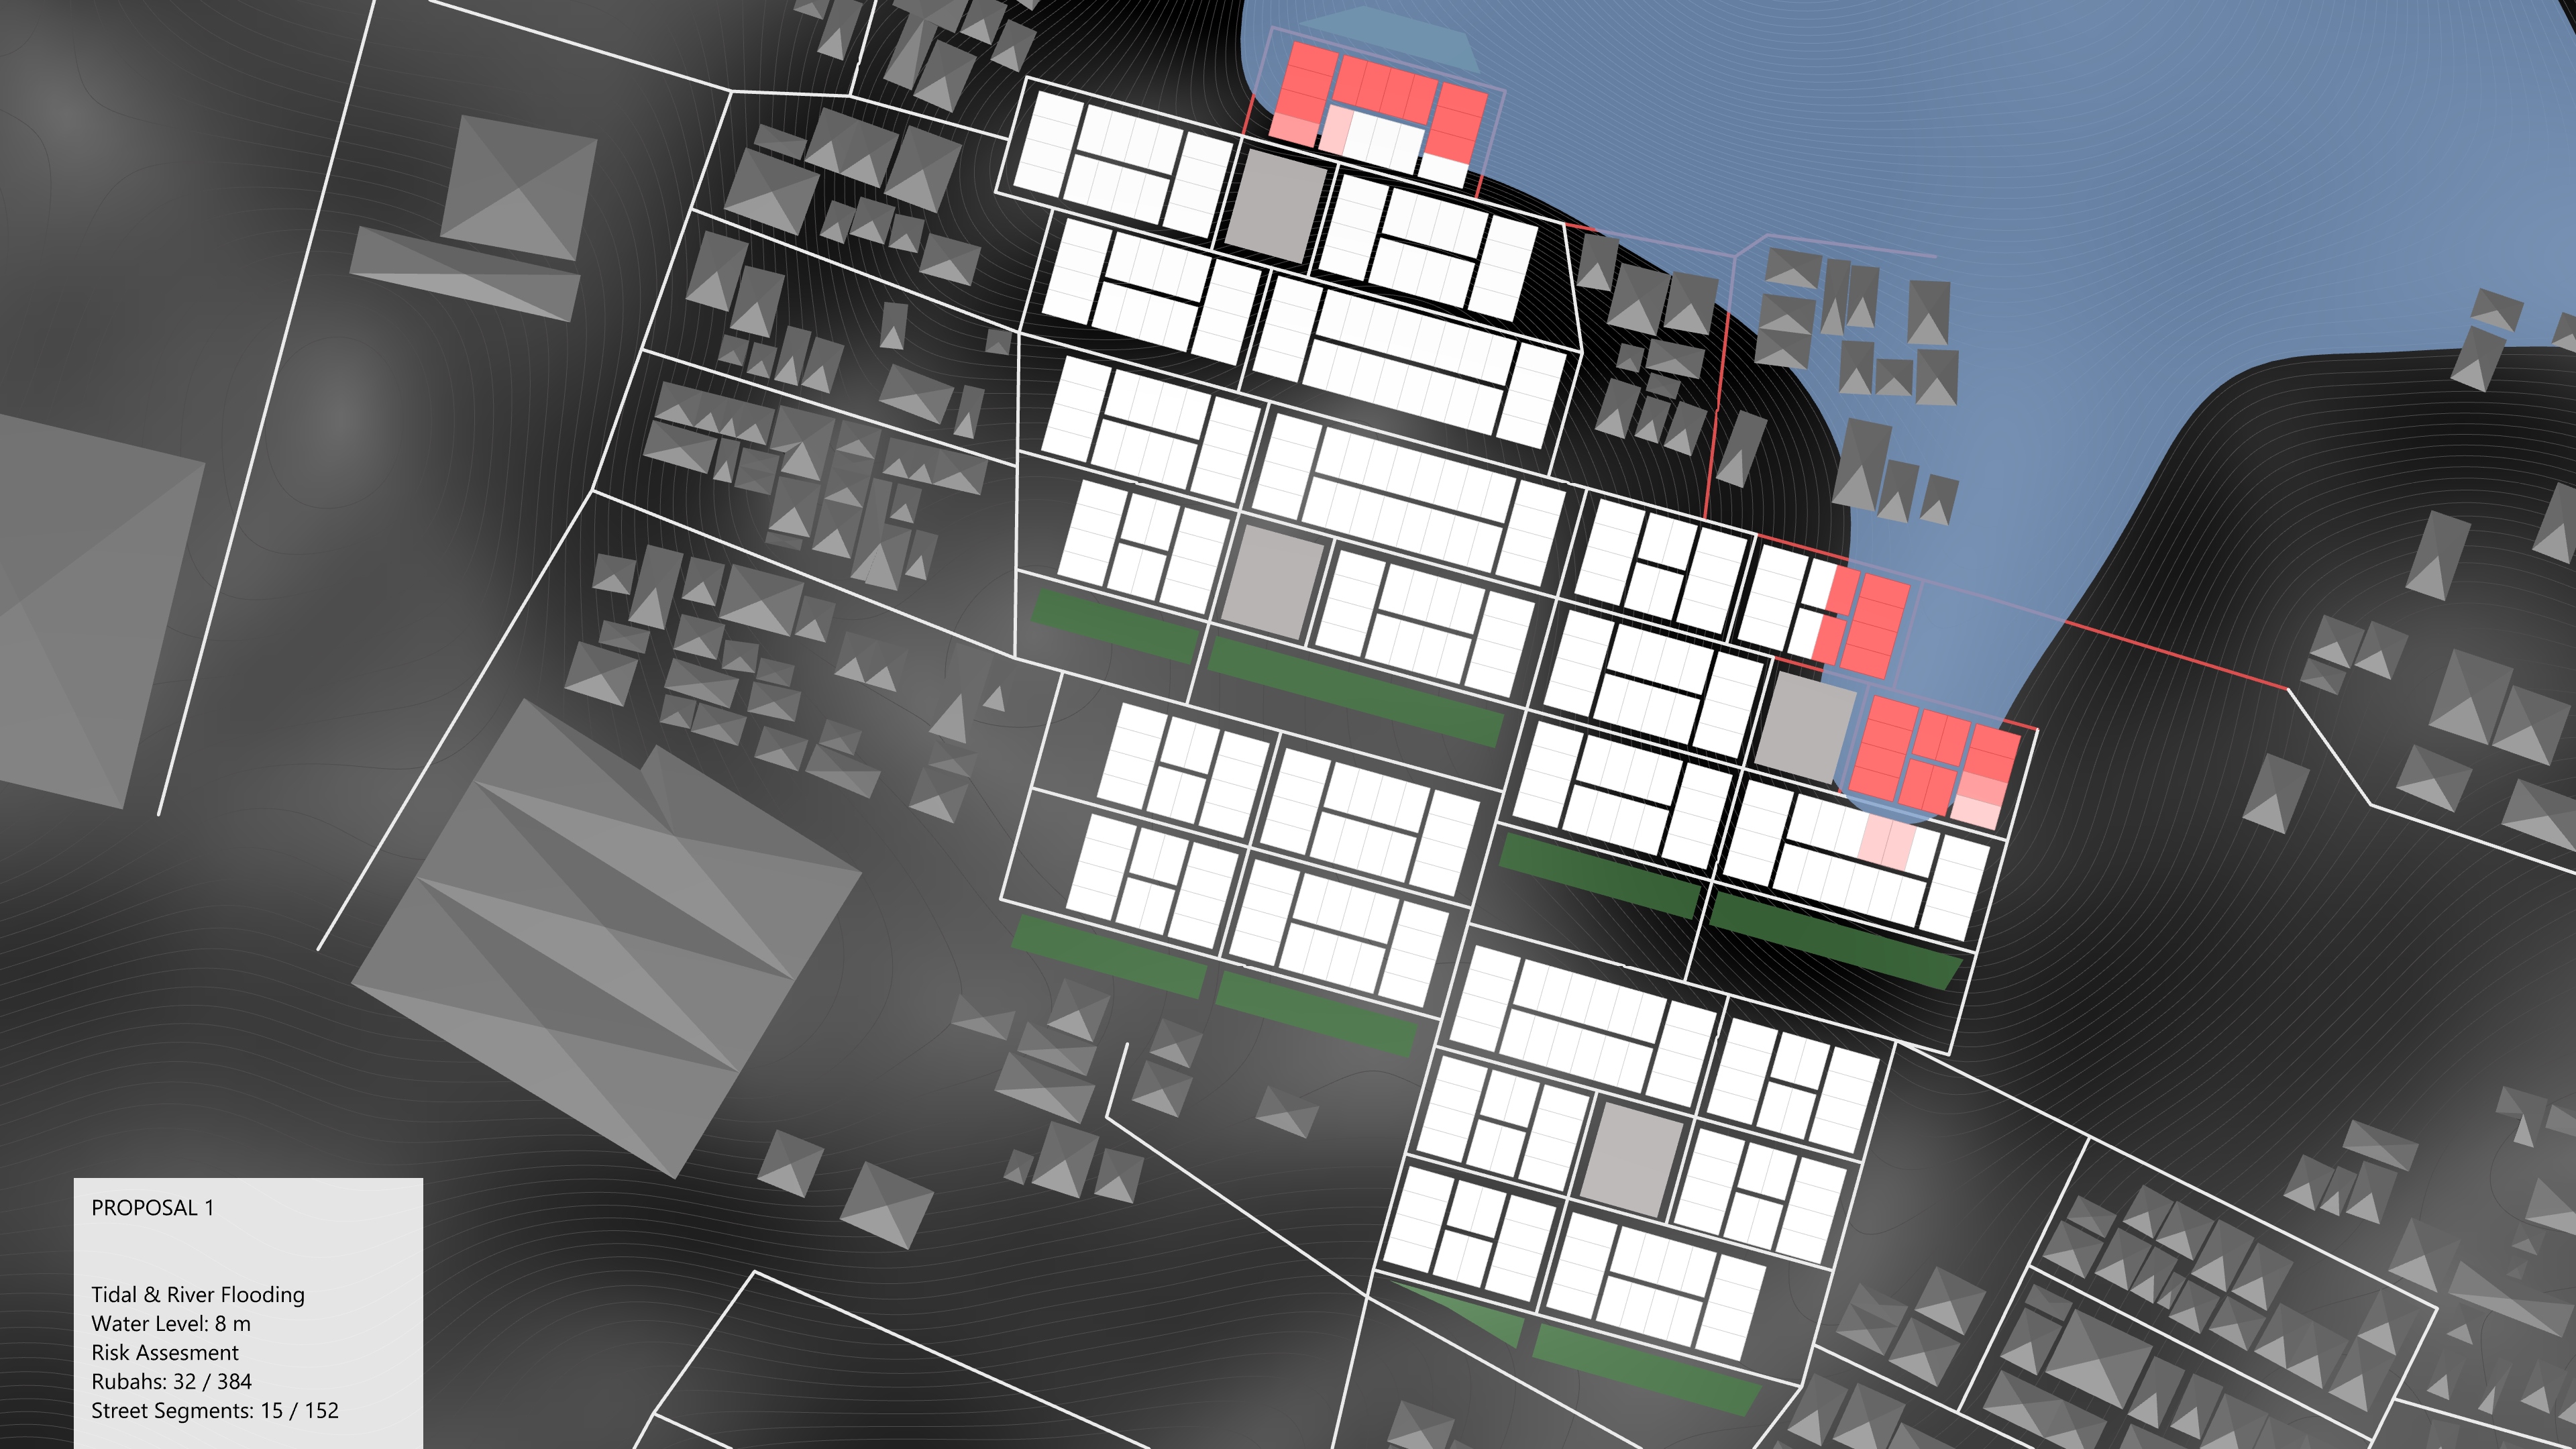
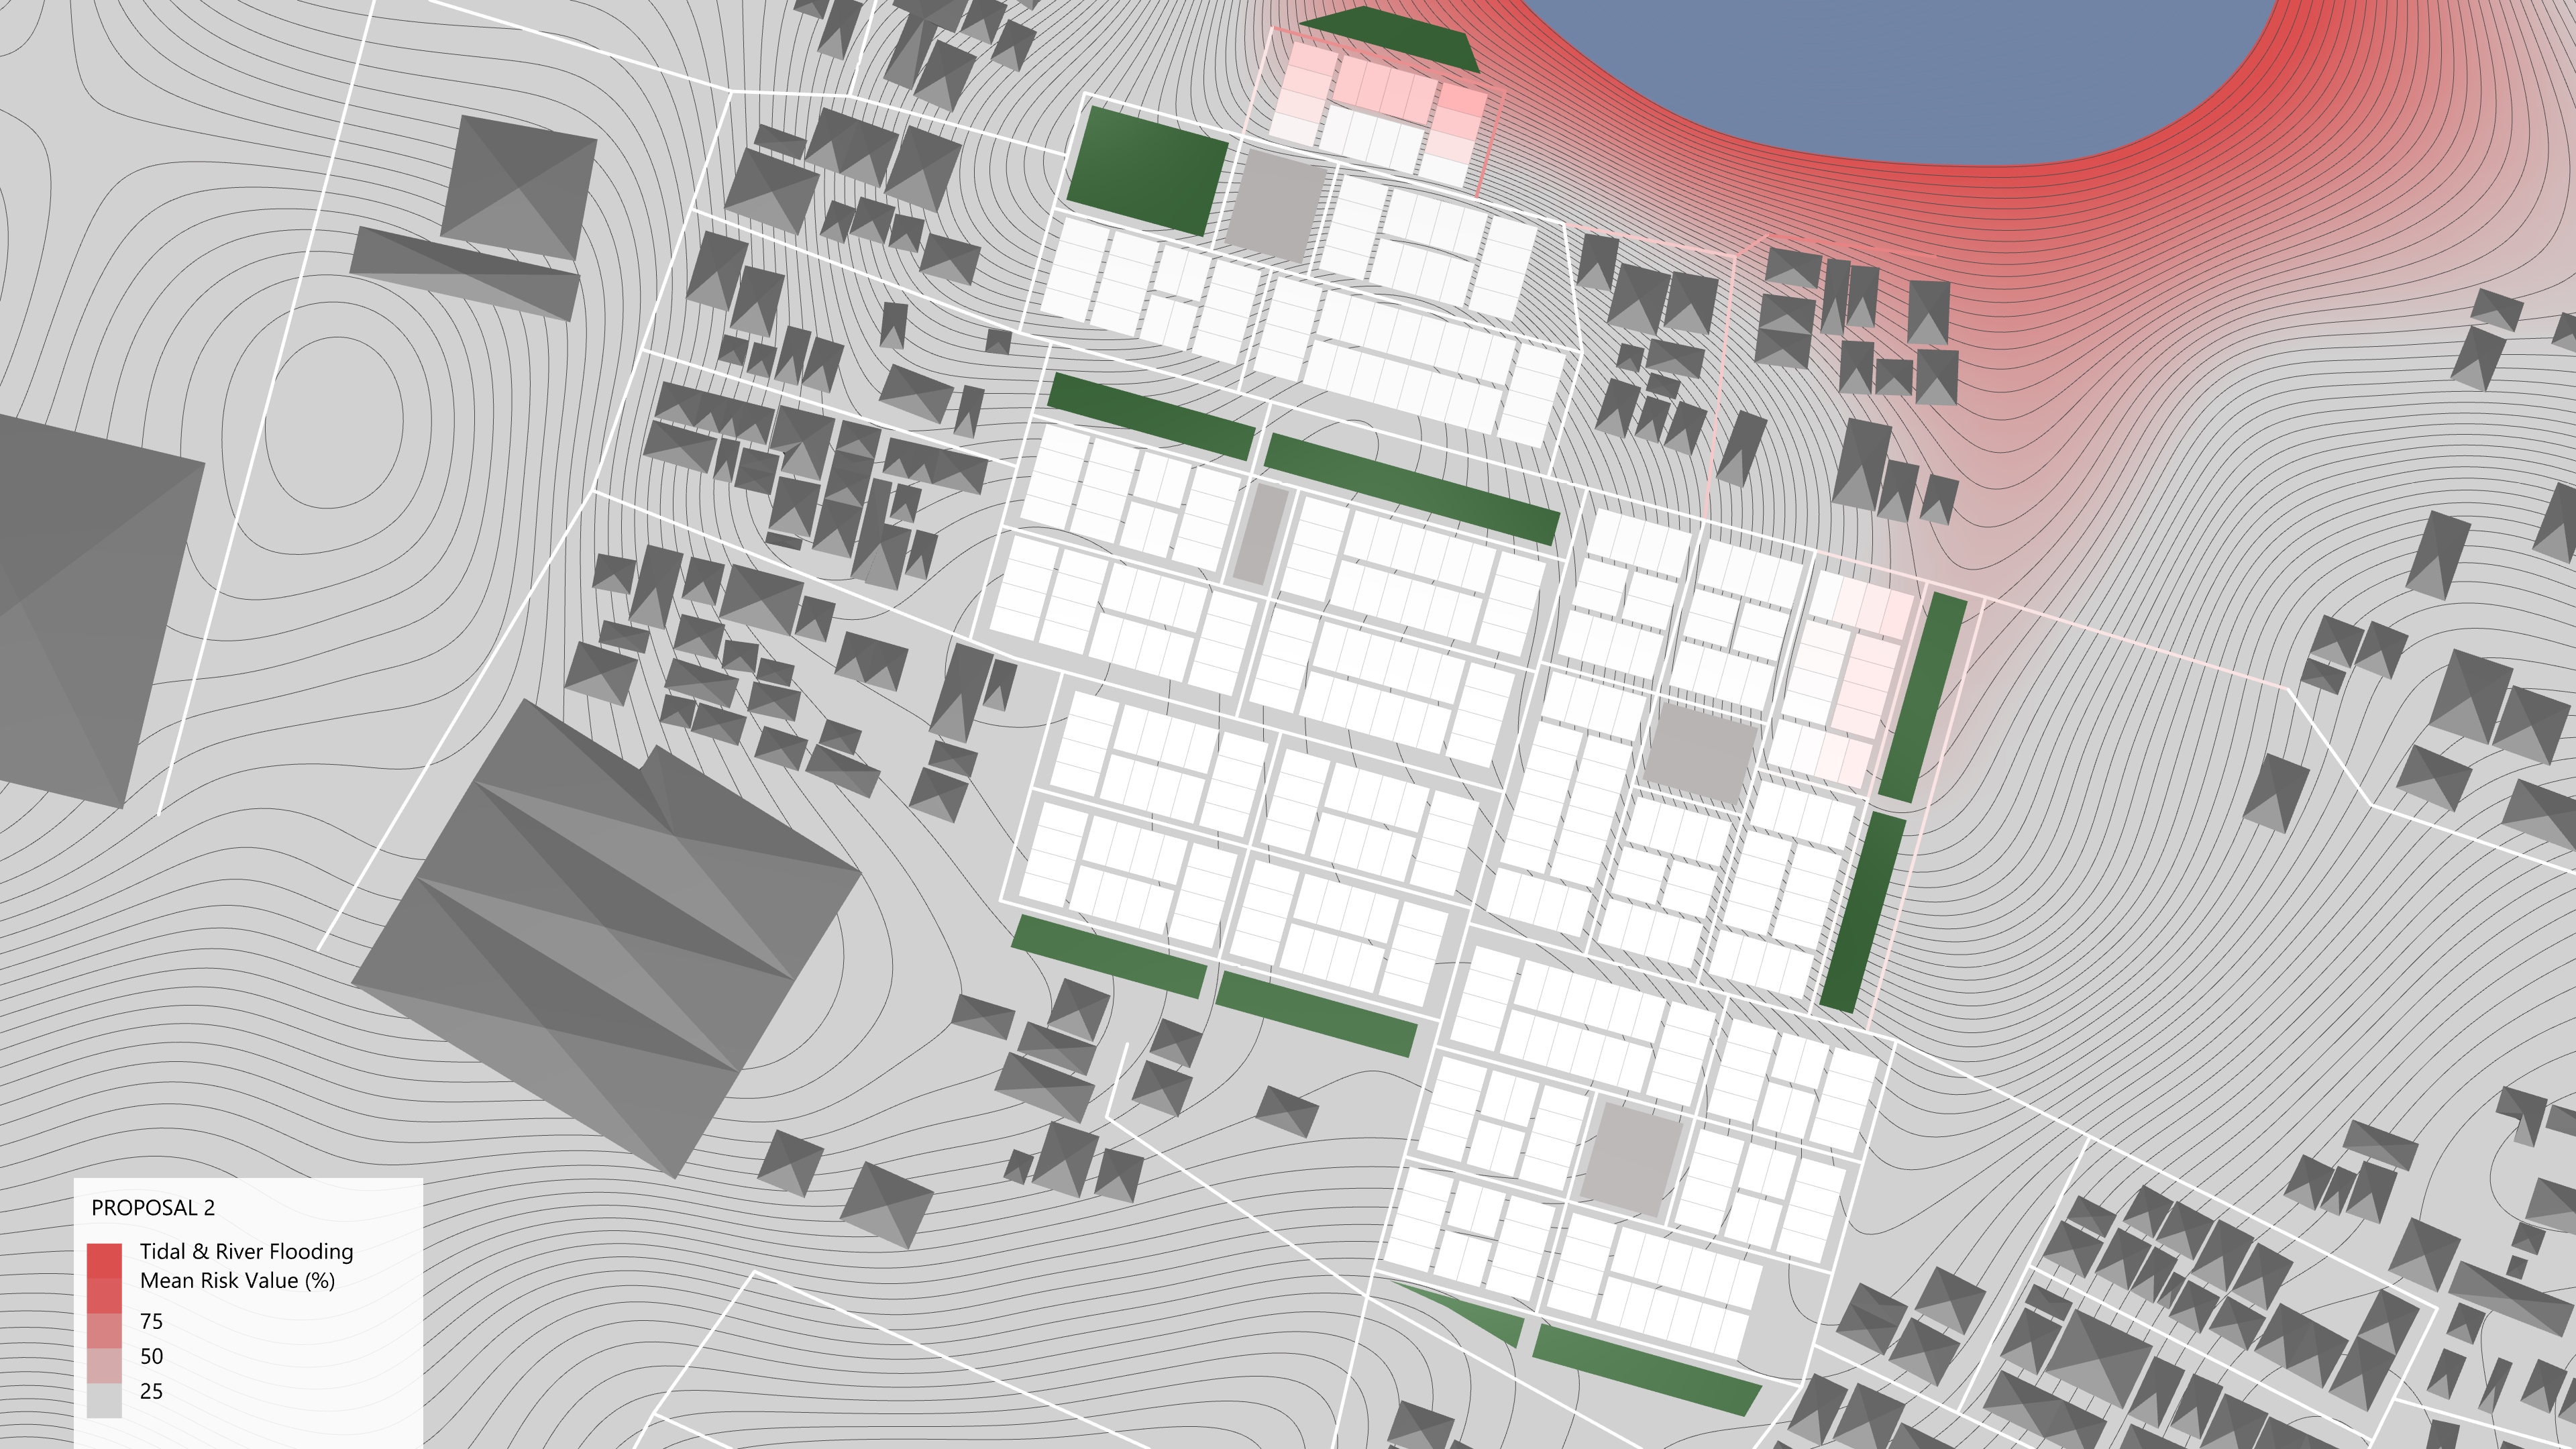
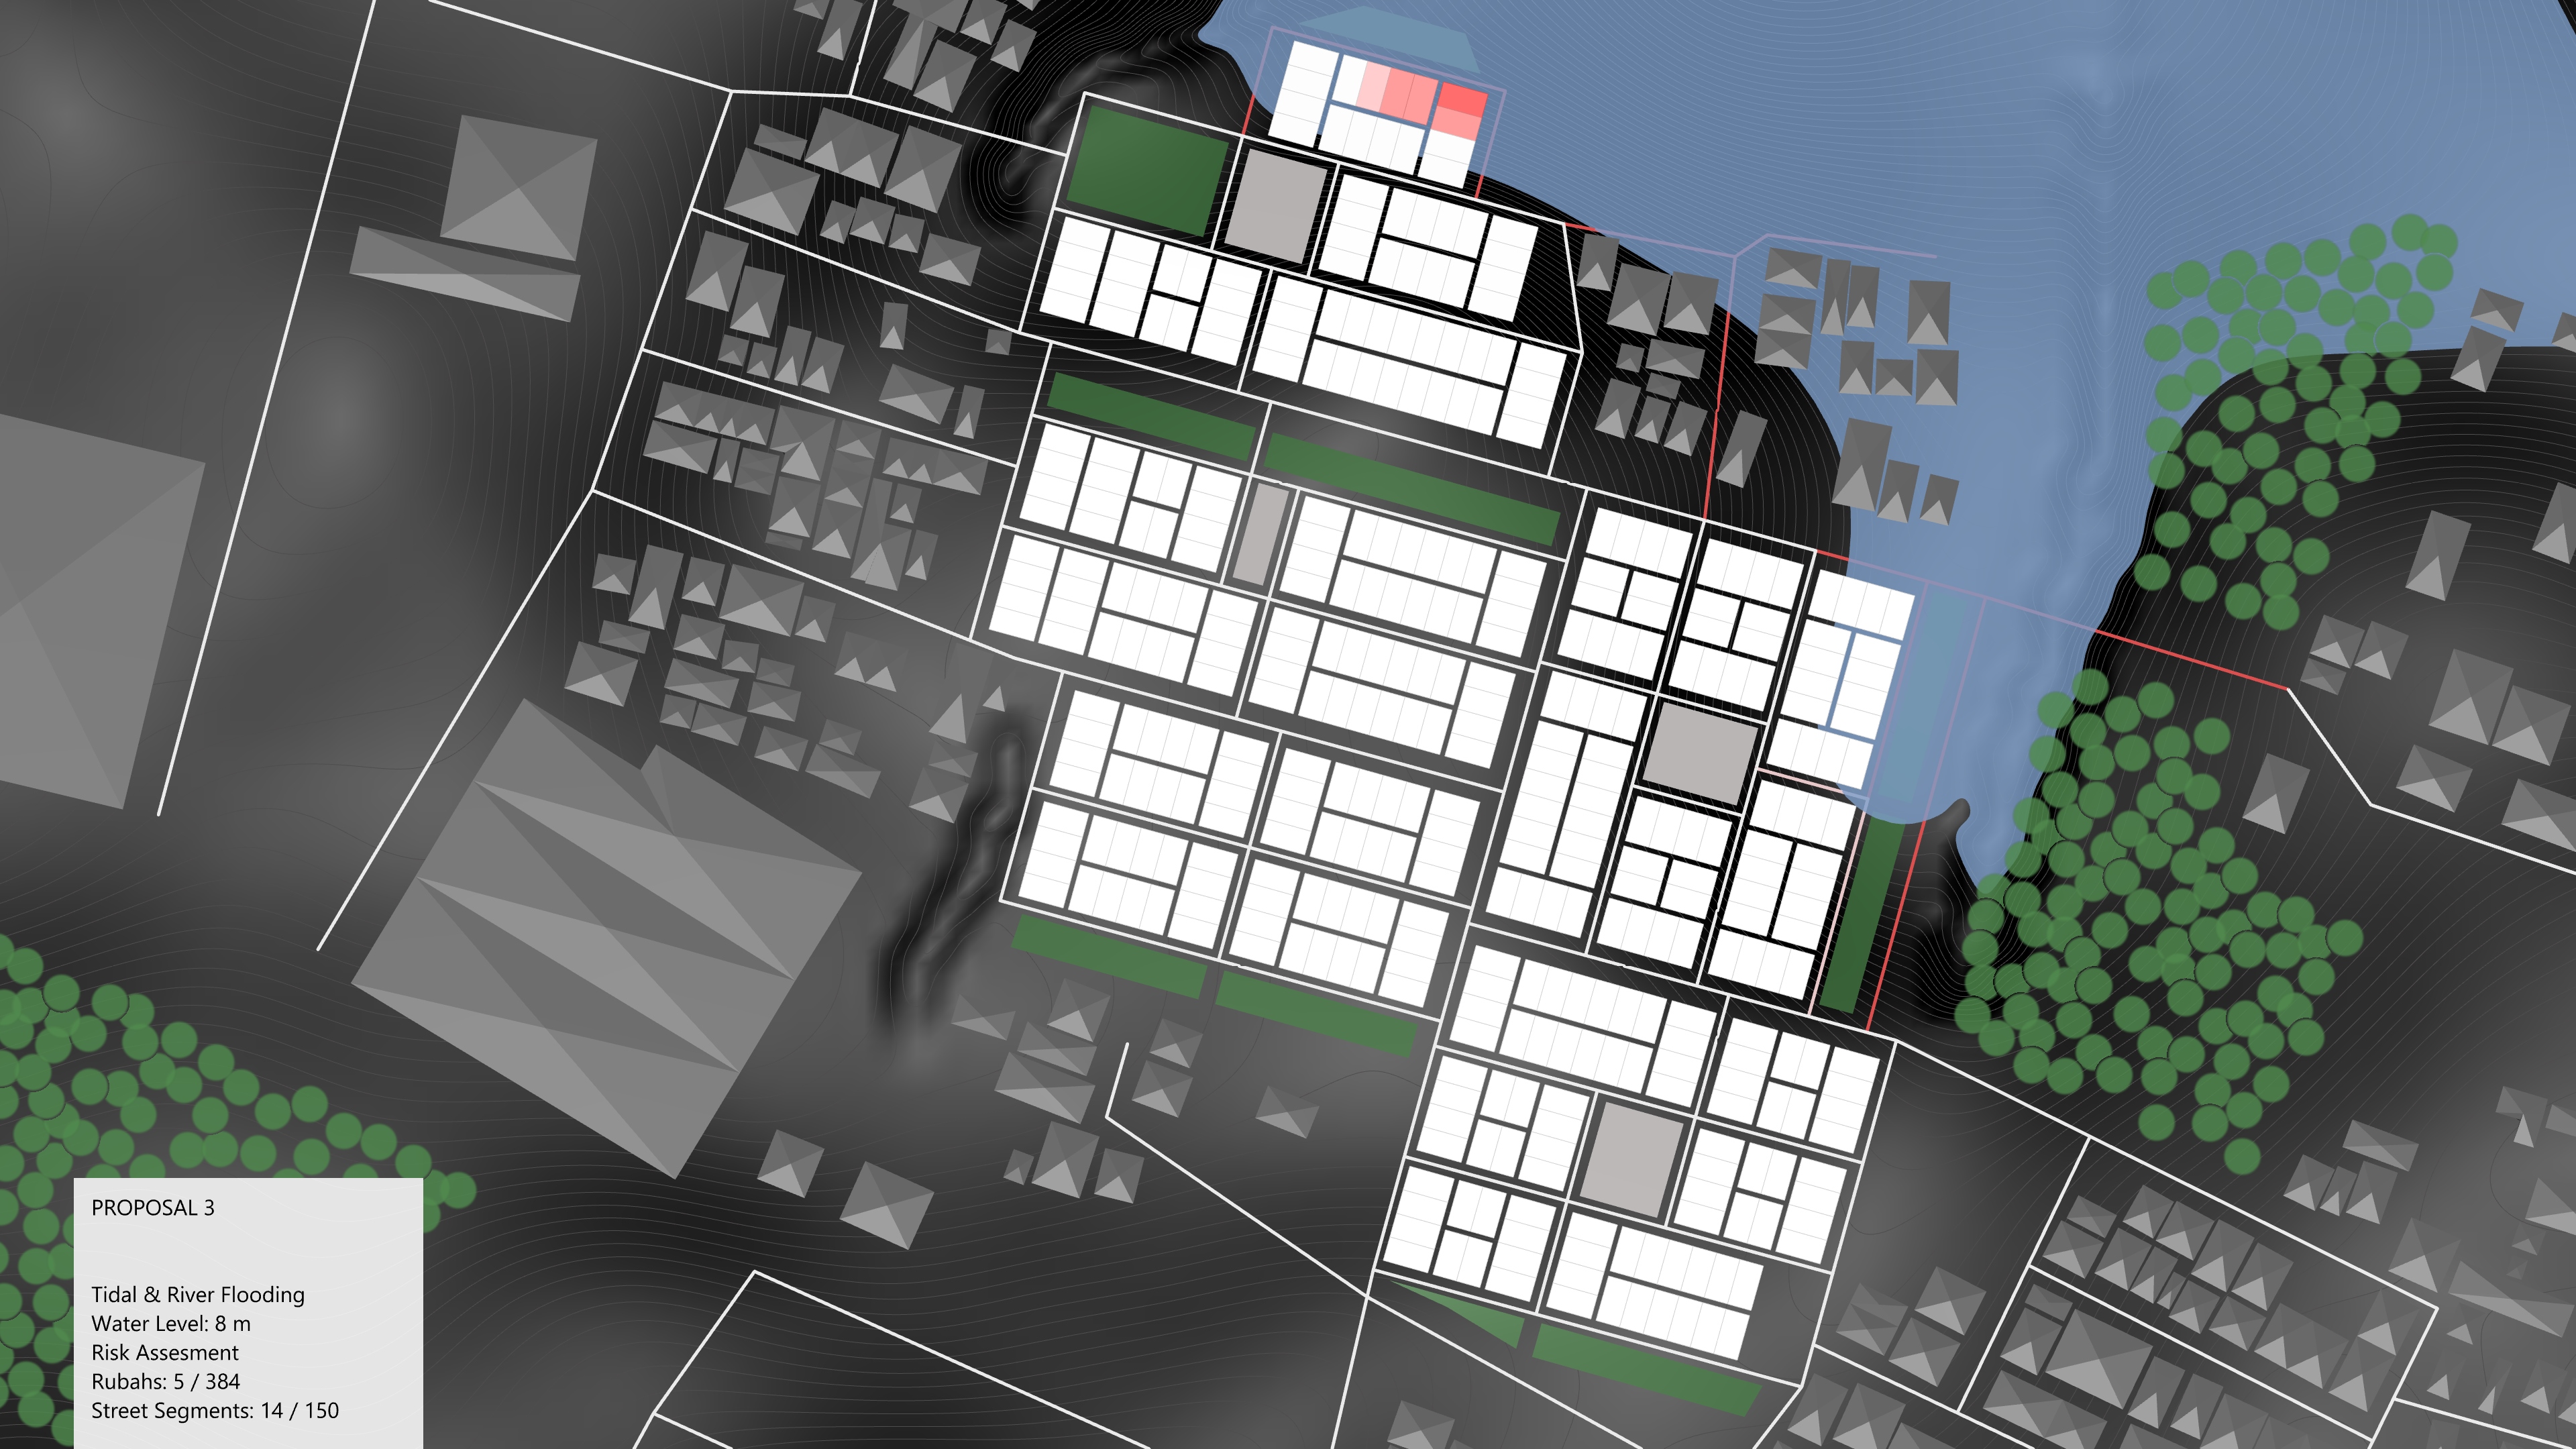
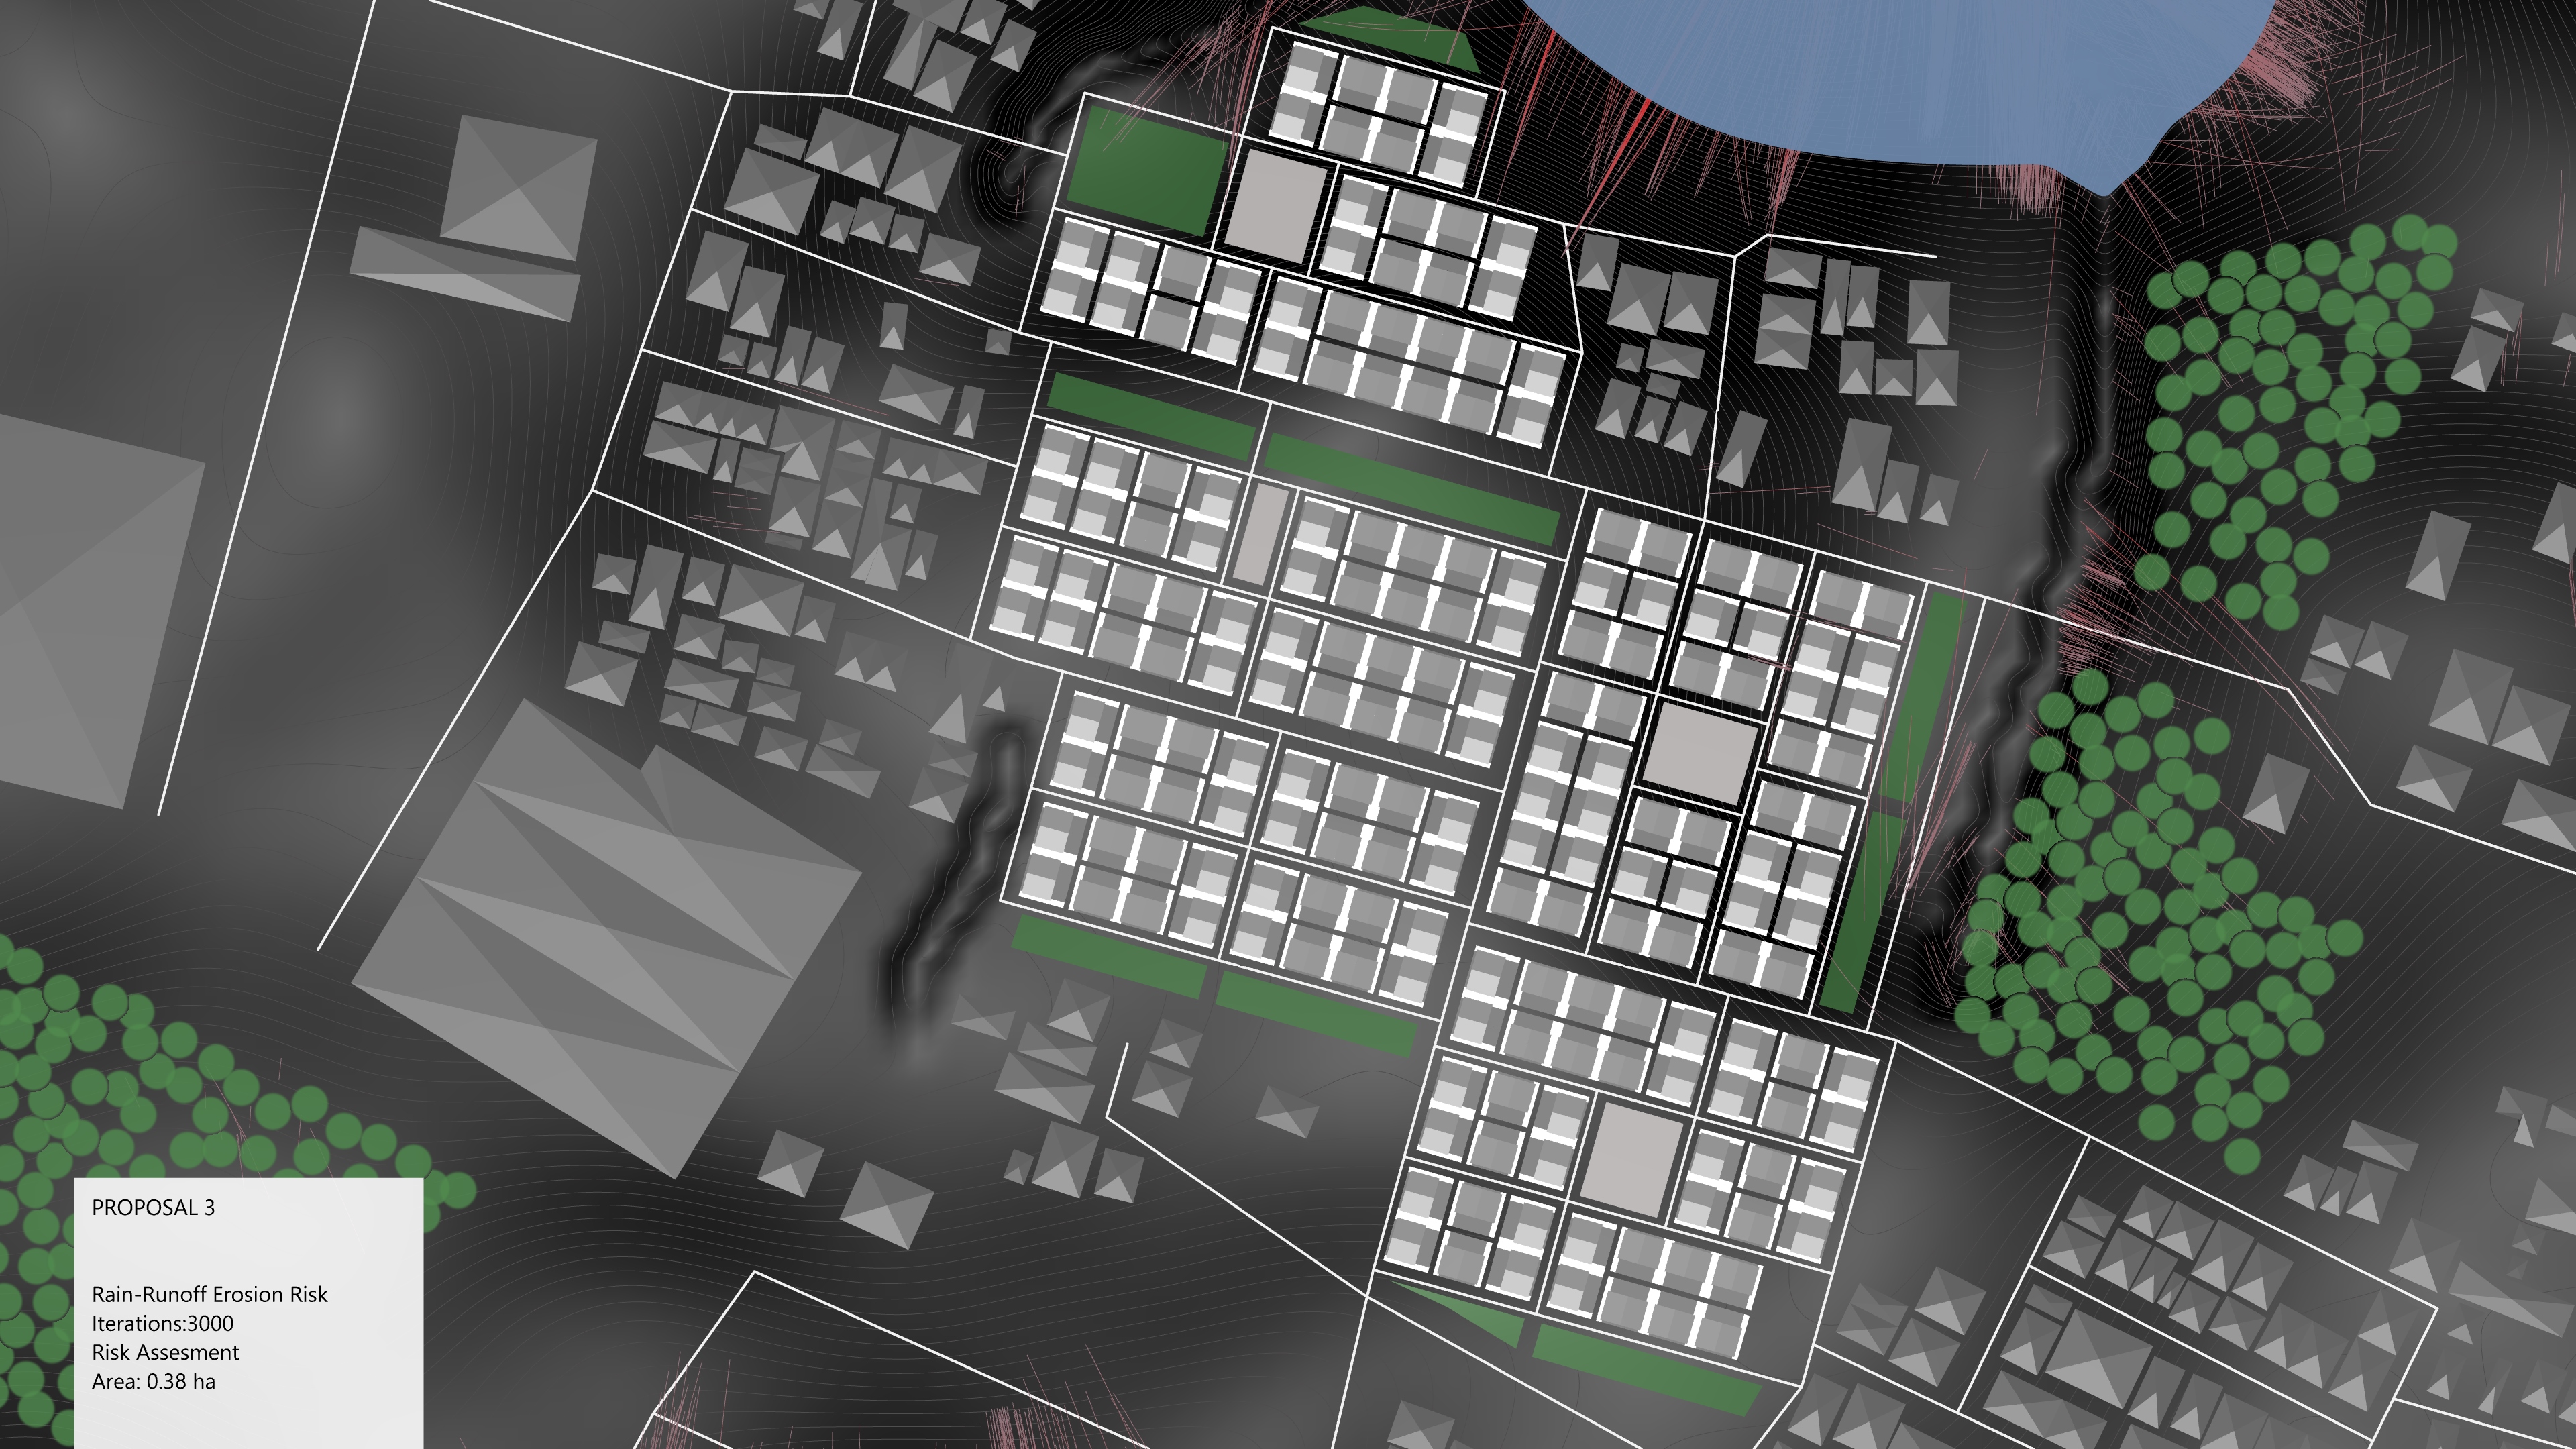
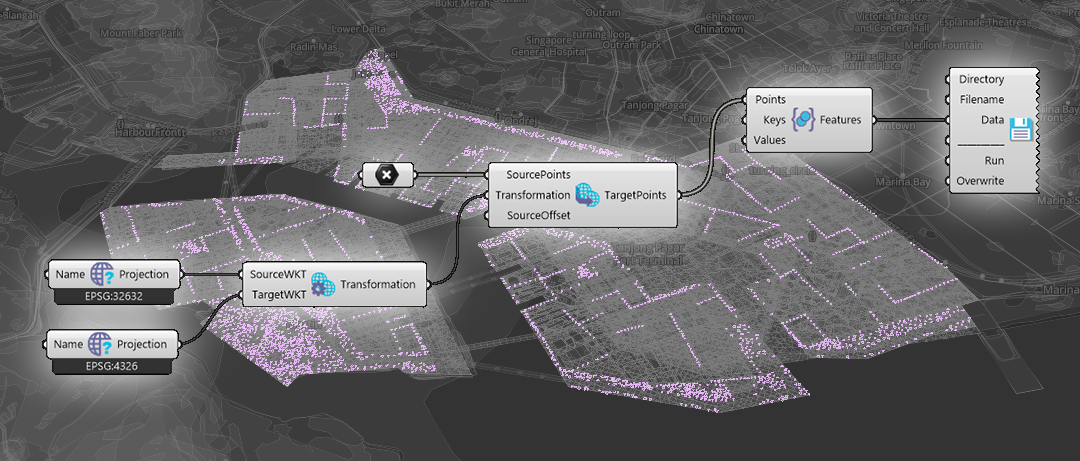
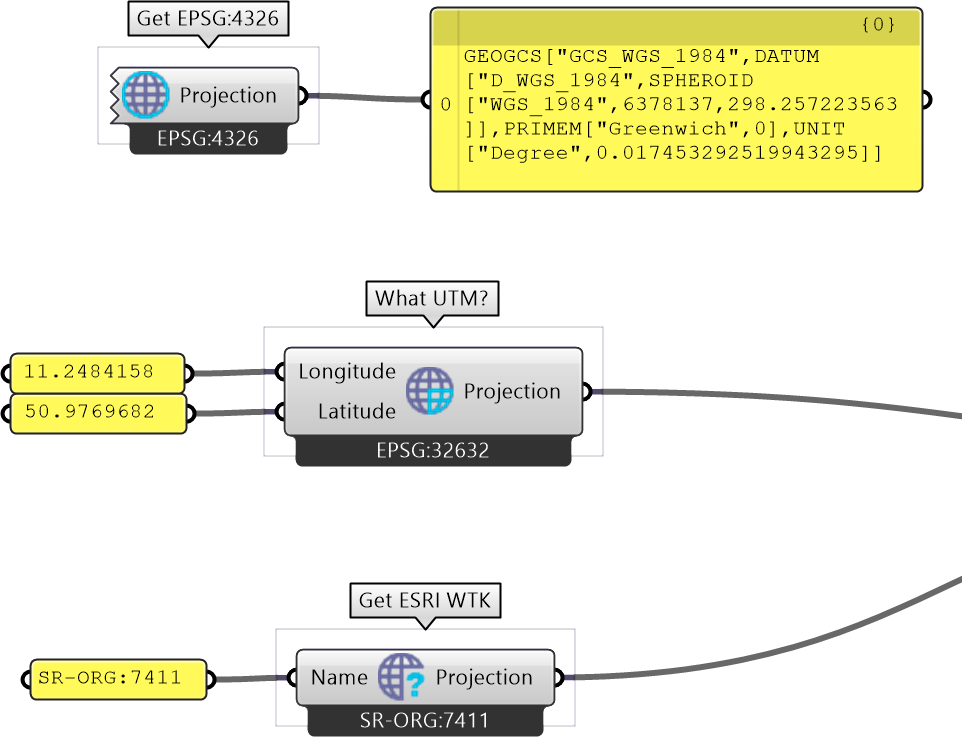
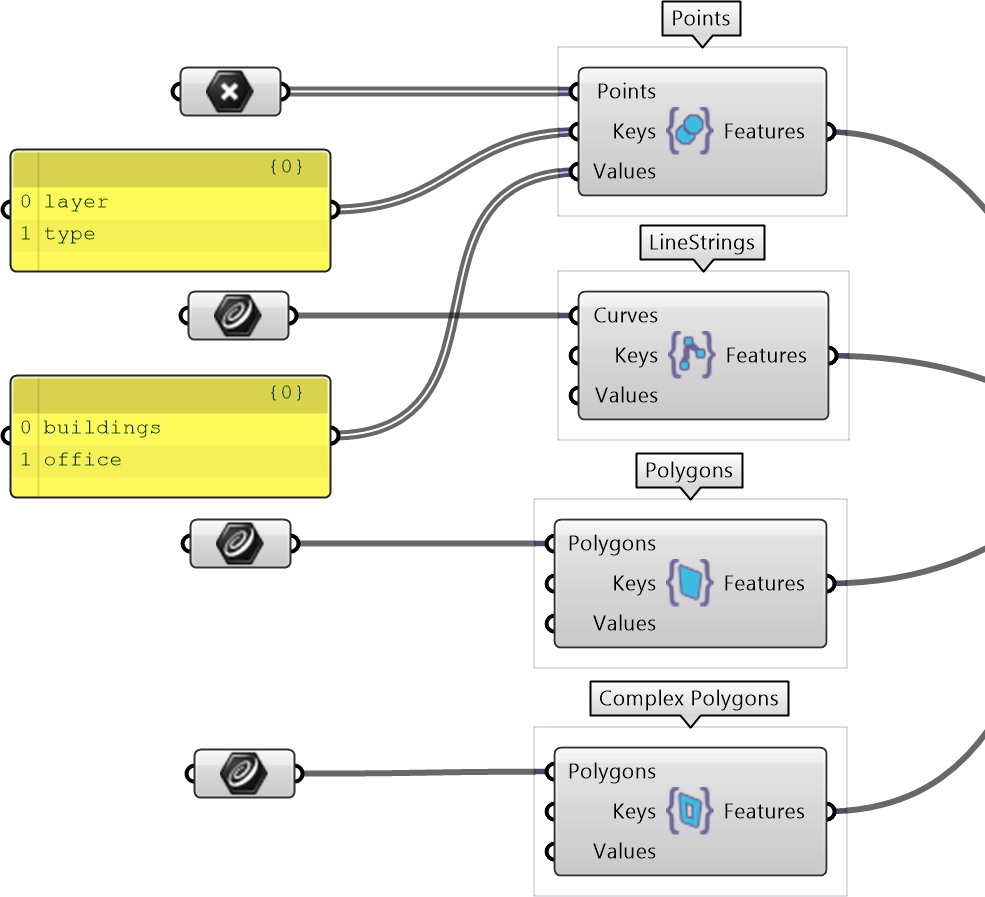
An example of a project exported from Grasshopper using the methods described.

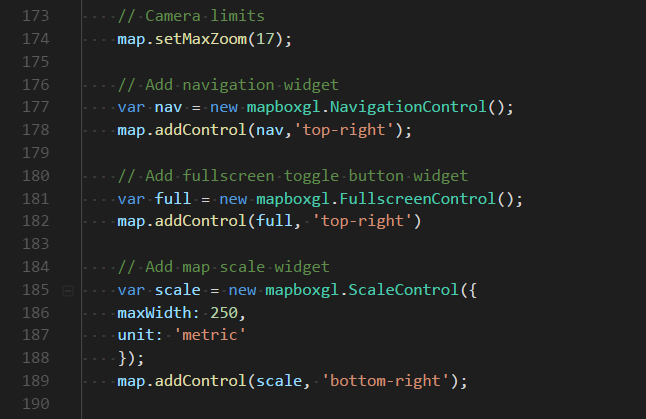
<style><!-- [et_pb_line_break_holder] --> /*-----CSS style for the layer and view selection widget-----*/<!-- [et_pb_line_break_holder] --> #layer-menu {<!-- [et_pb_line_break_holder] --> position: absolute;<!-- [et_pb_line_break_holder] --> z-index: 1;<!-- [et_pb_line_break_holder] --> top: 10px;<!-- [et_pb_line_break_holder] --> left: 10px;<!-- [et_pb_line_break_holder] --> width: 160px;<!-- [et_pb_line_break_holder] --> font-family: 'Open Sans', sans-serif;<!-- [et_pb_line_break_holder] --> }<!-- [et_pb_line_break_holder] --> #camera-menu {<!-- [et_pb_line_break_holder] --> position: absolute;<!-- [et_pb_line_break_holder] --> z-index: 1;<!-- [et_pb_line_break_holder] --> top: 10px;<!-- [et_pb_line_break_holder] --> right: 50px;<!-- [et_pb_line_break_holder] --> width: 80px;<!-- [et_pb_line_break_holder] --> font-family: 'Open Sans', sans-serif;<!-- [et_pb_line_break_holder] --> }<!-- [et_pb_line_break_holder] --> #function-menu {<!-- [et_pb_line_break_holder] --> position: absolute;<!-- [et_pb_line_break_holder] --> z-index: 1;<!-- [et_pb_line_break_holder] --> top: 10px;<!-- [et_pb_line_break_holder] --> right: 140px;<!-- [et_pb_line_break_holder] --> width: 140px;<!-- [et_pb_line_break_holder] --> font-family: 'Open Sans', sans-serif;<!-- [et_pb_line_break_holder] --> }<!-- [et_pb_line_break_holder] --> .dropbtn {<!-- [et_pb_line_break_holder] --> width: 100%;<!-- [et_pb_line_break_holder] --> position: relative;<!-- [et_pb_line_break_holder] --> z-index: 2;<!-- [et_pb_line_break_holder] --> background-color: #31b7bc; /*AIT colors*/;<!-- [et_pb_line_break_holder] --> color: white;<!-- [et_pb_line_break_holder] --> padding: 16px;<!-- [et_pb_line_break_holder] --> font-size: 16px;<!-- [et_pb_line_break_holder] --> border: none;<!-- [et_pb_line_break_holder] --> cursor: pointer;<!-- [et_pb_line_break_holder] --> outline: none;<!-- [et_pb_line_break_holder] --> border-radius: 4px;<!-- [et_pb_line_break_holder] --> box-shadow: 0px 0px 2px 0px rgba(0,0,0,0.5);<!-- [et_pb_line_break_holder] --> font-weight: 500;<!-- [et_pb_line_break_holder] --> }<!-- [et_pb_line_break_holder] --> .dropbtn:hover, .dropbtn:focus {<!-- [et_pb_line_break_holder] --> background-color: #22a1a1;<!-- [et_pb_line_break_holder] --> }<!-- [et_pb_line_break_holder] --> .dropdown-content {<!-- [et_pb_line_break_holder] --> border-radius: 5px;<!-- [et_pb_line_break_holder] --> text-align: left;<!-- [et_pb_line_break_holder] --> display: none;<!-- [et_pb_line_break_holder] --> position: absolute;<!-- [et_pb_line_break_holder] --> top: 55px;<!-- [et_pb_line_break_holder] --> background-color: #ffffff;<!-- [et_pb_line_break_holder] --> width: 100%;<!-- [et_pb_line_break_holder] --> overflow: auto;<!-- [et_pb_line_break_holder] --> box-shadow: 0px 0px 6px 0px rgba(0,0,0,0.4);<!-- [et_pb_line_break_holder] --> z-index: 1;<!-- [et_pb_line_break_holder] --> }<!-- [et_pb_line_break_holder] --> .dropdown-content a {<!-- [et_pb_line_break_holder] --> color: black;<!-- [et_pb_line_break_holder] --> padding: 12px 16px;<!-- [et_pb_line_break_holder] --> text-decoration: none;<!-- [et_pb_line_break_holder] --> display: block;<!-- [et_pb_line_break_holder] --> border-top: 1px solid #ddd;<!-- [et_pb_line_break_holder] --> }<!-- [et_pb_line_break_holder] --> .dropdown-content a.Off {<!-- [et_pb_line_break_holder] --> color: #6b6b6b;<!-- [et_pb_line_break_holder] --> background: #f9f9f9;<!-- [et_pb_line_break_holder] --> }<!-- [et_pb_line_break_holder] --> .dropdown-content a:hover {background-color: rgb(240, 240, 240);}<!-- [et_pb_line_break_holder] --><!-- [et_pb_line_break_holder] --> .show {display: block;} <!-- [et_pb_line_break_holder] --><!-- [et_pb_line_break_holder] --> /*-----CSS style for the element info popup widget-----*/<!-- [et_pb_line_break_holder] --> dd {<!-- [et_pb_line_break_holder] --> margin-left: 0;<!-- [et_pb_line_break_holder] --> margin-bottom: 8px;<!-- [et_pb_line_break_holder] --> font-weight: bold;<!-- [et_pb_line_break_holder] --> }<!-- [et_pb_line_break_holder] --> dt {<!-- [et_pb_line_break_holder] --> color: #31b7bc; /*AIT colors*/<!-- [et_pb_line_break_holder] --> }<!-- [et_pb_line_break_holder] --> dl {<!-- [et_pb_line_break_holder] --> margin-bottom: 0;<!-- [et_pb_line_break_holder] --> }<!-- [et_pb_line_break_holder] --> .mapboxgl-popup-anchor-bottom .mapboxgl-popup-tip{<!-- [et_pb_line_break_holder] --> border-top-color: #31b7bc; /*AIT colors*/<!-- [et_pb_line_break_holder] --> }<!-- [et_pb_line_break_holder] --> .mapboxgl-popup-content{<!-- [et_pb_line_break_holder] --> font-size: 14px;<!-- [et_pb_line_break_holder] --> color: white;<!-- [et_pb_line_break_holder] --> background-color: rgba(0, 0, 0, 0.8);<!-- [et_pb_line_break_holder] --> box-shadow: 0 0 0px 2px #31b7bc; /*AIT colors*/<!-- [et_pb_line_break_holder] --> min-width: 120px;<!-- [et_pb_line_break_holder] --> max-width: 300px;<!-- [et_pb_line_break_holder] --> max-height: 170px;<!-- [et_pb_line_break_holder] --> overflow-y: auto;<!-- [et_pb_line_break_holder] --> }<!-- [et_pb_line_break_holder] --> .mapboxgl-popup-close-button{<!-- [et_pb_line_break_holder] --> color: white;<!-- [et_pb_line_break_holder] --> font-size: 20px;<!-- [et_pb_line_break_holder] --> }<!-- [et_pb_line_break_holder] --><!-- [et_pb_line_break_holder] --> /*-----CSS style for the map scale widget-----*/<!-- [et_pb_line_break_holder] --> .mapboxgl-ctrl-scale {<!-- [et_pb_line_break_holder] --> background-color: rgba(0, 0, 0, 0.75);<!-- [et_pb_line_break_holder] --> font-size: 12px;<!-- [et_pb_line_break_holder] --> border-width: medium 2px 3px;<!-- [et_pb_line_break_holder] --> border-style: none none solid;<!-- [et_pb_line_break_holder] --> border-color: #31b7bc; /*AIT colors*/<!-- [et_pb_line_break_holder] --> padding: 0 5px;<!-- [et_pb_line_break_holder] --> color: white;<!-- [et_pb_line_break_holder] --> box-sizing: border-box;<!-- [et_pb_line_break_holder] --> }<!-- [et_pb_line_break_holder] --><!-- [et_pb_line_break_holder] --> /*-----CSS style for copyright-----*/<!-- [et_pb_line_break_holder] --> #copyright {<!-- [et_pb_line_break_holder] --> font-size: 9px;<!-- [et_pb_line_break_holder] --> color:white;<!-- [et_pb_line_break_holder] --> text-align: center;<!-- [et_pb_line_break_holder] --> }<!-- [et_pb_line_break_holder] --> #copyright a {<!-- [et_pb_line_break_holder] --> color:#31b7bc; /*AIT colors*/<!-- [et_pb_line_break_holder] --> text-decoration: none;<!-- [et_pb_line_break_holder] --> font-weight: 1000;<!-- [et_pb_line_break_holder] --> }<!-- [et_pb_line_break_holder] --> </style><!-- [et_pb_line_break_holder] --><!-- [et_pb_line_break_holder] --> <div id='map' style='min-height: 500px; min-width: 460px;'> <!-- MapBox container --><!-- [et_pb_line_break_holder] --> <nav id="layer-menu"><!-- [et_pb_line_break_holder] --> <button onclick="dropdownToggle('layerDropdown')" class="dropbtn"><!-- [et_pb_line_break_holder] --> Select scenario</button><!-- [et_pb_line_break_holder] --> <div id="layerDropdown" class="dropdown-content"></div><!-- [et_pb_line_break_holder] --> <div id = "copyright">created at <a target="_blank" <!-- [et_pb_line_break_holder] --> href="https://cities.ait.ac.at/site/">AIT</a><!-- [et_pb_line_break_holder] --> by Ondrej Vesely,  2018</div><!-- [et_pb_line_break_holder] --> </nav><!-- [et_pb_line_break_holder] --> <nav id="camera-menu"><!-- [et_pb_line_break_holder] --> <button onclick="dropdownToggle('cameraDropdown')" class="dropbtn"><!-- [et_pb_line_break_holder] --> Views</button><!-- [et_pb_line_break_holder] --> <div id="cameraDropdown" class="dropdown-content"></div><!-- [et_pb_line_break_holder] --> </nav><!-- [et_pb_line_break_holder] --> <nav id="function-menu"><!-- [et_pb_line_break_holder] --> <button onclick="dropdownToggle('functionDropdown')" class="dropbtn"><!-- [et_pb_line_break_holder] --> Functions</button><!-- [et_pb_line_break_holder] --> <div id="functionDropdown" class="dropdown-content"></div><!-- [et_pb_line_break_holder] --> </nav><!-- [et_pb_line_break_holder] --> </div><!-- [et_pb_line_break_holder] --><!-- [et_pb_line_break_holder] --> <script><!-- [et_pb_line_break_holder] --><!-- [et_pb_line_break_holder] --> // Load Map via Mapbox API<!-- [et_pb_line_break_holder] --> mapboxgl.accessToken = 'pk.eyJ1Ijoib25kcmVqLXZlc2VseSIsImEiOiJjamlhOWo3cnkwMnY3M3ZwZjU5bm54c3BsIn0.69pwP4aK4CmFBlpU8I4giw';<!-- [et_pb_line_break_holder] --> // dont forget to change this accessToken to you own if you use this code<!-- [et_pb_line_break_holder] --> var map = new mapboxgl.Map({<!-- [et_pb_line_break_holder] --> container: 'map',<!-- [et_pb_line_break_holder] --> style: 'mapbox://styles/ondrej-vesely/cjjsritez0dx42ro0vz8l2ks4'<!-- [et_pb_line_break_holder] --> });<!-- [et_pb_line_break_holder] --><!-- [et_pb_line_break_holder] --> // Camera limits<!-- [et_pb_line_break_holder] --> map.setMaxZoom(17);<!-- [et_pb_line_break_holder] --><!-- [et_pb_line_break_holder] --> // Add navigation widget<!-- [et_pb_line_break_holder] --> var nav = new mapboxgl.NavigationControl();<!-- [et_pb_line_break_holder] --> map.addControl(nav,'top-right');<!-- [et_pb_line_break_holder] --><!-- [et_pb_line_break_holder] --> // Add fullscreen toggle button widget<!-- [et_pb_line_break_holder] --> var full = new mapboxgl.FullscreenControl();<!-- [et_pb_line_break_holder] --> map.addControl(full, 'top-right')<!-- [et_pb_line_break_holder] --><!-- [et_pb_line_break_holder] --> // Add map scale widget<!-- [et_pb_line_break_holder] --> var scale = new mapboxgl.ScaleControl({<!-- [et_pb_line_break_holder] --> maxWidth: 250,<!-- [et_pb_line_break_holder] --> unit: 'metric'<!-- [et_pb_line_break_holder] --> });<!-- [et_pb_line_break_holder] --> map.addControl(scale, 'bottom-right');<!-- [et_pb_line_break_holder] --><!-- [et_pb_line_break_holder] --> // On start wait till map loads,<!-- [et_pb_line_break_holder] --> map.on('load', function() {<!-- [et_pb_line_break_holder] --> // move camera a bit,<!-- [et_pb_line_break_holder] --> map.flyTo({center: [103.84, 1.2680], zoom: 13.8, speed: 0.1, bearing: 4})<!-- [et_pb_line_break_holder] --> // and open welcome popup<!-- [et_pb_line_break_holder] --> helpPopup()<!-- [et_pb_line_break_holder] --> });<!-- [et_pb_line_break_holder] --> <!-- [et_pb_line_break_holder] --><!-- [et_pb_line_break_holder] --> // --- The interesting stuff starts here ----<!-- [et_pb_line_break_holder] --><!-- [et_pb_line_break_holder] --> // Dropdowns<!-- [et_pb_line_break_holder] --> // When the user clicks on the button, <!-- [et_pb_line_break_holder] --> // toggle between hiding and showing the dropdown content<!-- [et_pb_line_break_holder] --> function dropdownToggle(id) {<!-- [et_pb_line_break_holder] --> document.getElementById(id).classList.toggle("show");<!-- [et_pb_line_break_holder] --> }<!-- [et_pb_line_break_holder] --> // Layers which include multiple variants and should filtered based on displayed scenario<!-- [et_pb_line_break_holder] --> var scenLayers = [<!-- [et_pb_line_break_holder] --> 'land', 'land2', 'buildings', 'streets', 'trees', 'bridges', 'floors', 'syntax',<!-- [et_pb_line_break_holder] --> 'solar'<!-- [et_pb_line_break_holder] --> ]<!-- [et_pb_line_break_holder] --><!-- [et_pb_line_break_holder] --> // List of variants included in the data<!-- [et_pb_line_break_holder] --> var scenNames = ['scen1', 'scen3', 'scen5']<!-- [et_pb_line_break_holder] --> var scenNiceNames = ['Green Loop City', 'Garden City', 'Oceanfront']<!-- [et_pb_line_break_holder] --><!-- [et_pb_line_break_holder] --> // Add scenario names to dropdown to chenge scenario filter on click<!-- [et_pb_line_break_holder] --> for (var i = 0; i < scenNames.length; i++) {<!-- [et_pb_line_break_holder] --> var id = scenNames[i];<!-- [et_pb_line_break_holder] --> var name = scenNiceNames[i];<!-- [et_pb_line_break_holder] --> var link = document.createElement('a');<!-- [et_pb_line_break_holder] --> link.href = 'javascript:changeScen("' + id + '")';<!-- [et_pb_line_break_holder] --> link.textContent = name;<!-- [et_pb_line_break_holder] --> var $layerDropdown = document.getElementById('layerDropdown');<!-- [et_pb_line_break_holder] --> $layerDropdown.appendChild(link);<!-- [et_pb_line_break_holder] --> }<!-- [et_pb_line_break_holder] --> // Scenario change - Loops trough list of scenario layers,<!-- [et_pb_line_break_holder] --> // sets variant filter to given scenario name<!-- [et_pb_line_break_holder] --> function changeScen(id) {<!-- [et_pb_line_break_holder] --> for (var i = 0; i < scenLayers.length; i++) {<!-- [et_pb_line_break_holder] --> var layer = scenLayers[i];<!-- [et_pb_line_break_holder] --> filter = map.getFilter(layer); // gets current filter settings<!-- [et_pb_line_break_holder] --> for (var j = 0; j < filter.length; j++) {<!-- [et_pb_line_break_holder] --> if (filter[j][1] == "var") { // Key under which you specify variants<!-- [et_pb_line_break_holder] --> filter[j][2] = id; // change the Value to "id" (scenario name)<!-- [et_pb_line_break_holder] --> }<!-- [et_pb_line_break_holder] --> }<!-- [et_pb_line_break_holder] --> map.setFilter(layer, filter);<!-- [et_pb_line_break_holder] --> }<!-- [et_pb_line_break_holder] --> }<!-- [et_pb_line_break_holder] --><!-- [et_pb_line_break_holder] --> // For the cameras you want to save, put its position as CameraOptions here<!-- [et_pb_line_break_holder] --> var cameras = [<!-- [et_pb_line_break_holder] --> {center: [103.836607, 1.272156], zoom: 17, bearing: 136, pitch: 60}, <!-- [et_pb_line_break_holder] --> {center: [103.846564, 1.272998], zoom: 16, bearing: -180, pitch: 60}, <!-- [et_pb_line_break_holder] --> {center: [103.832839, 1.259721], zoom: 15, bearing: 0, pitch: 0}];<!-- [et_pb_line_break_holder] --> var cameraNames = ['Station', 'CBD', 'Island']<!-- [et_pb_line_break_holder] --><!-- [et_pb_line_break_holder] --> // Add views to camera dropdown to switch cameras on click<!-- [et_pb_line_break_holder] --> for (var i = 0; i < cameras.length; i++) {<!-- [et_pb_line_break_holder] --> var name = cameraNames[i]<!-- [et_pb_line_break_holder] --> var link = document.createElement('a');<!-- [et_pb_line_break_holder] --> link.href = 'javascript:changeCamera(cameras[' + i + '])';<!-- [et_pb_line_break_holder] --> link.textContent = name;<!-- [et_pb_line_break_holder] --> var $cameraDropdown = document.getElementById('cameraDropdown');<!-- [et_pb_line_break_holder] --> $cameraDropdown.appendChild(link);<!-- [et_pb_line_break_holder] --> }<!-- [et_pb_line_break_holder] --> // View switching<!-- [et_pb_line_break_holder] --> function changeCamera(cameraOptions){<!-- [et_pb_line_break_holder] --> // You can set camera fly speed here<!-- [et_pb_line_break_holder] --> cameraOptions['speed'] = '0.5';<!-- [et_pb_line_break_holder] --> map.flyTo(cameraOptions);<!-- [et_pb_line_break_holder] --> }<!-- [et_pb_line_break_holder] --><!-- [et_pb_line_break_holder] --> <!-- [et_pb_line_break_holder] --> // List of additional functions you want to include as tools<!-- [et_pb_line_break_holder] --> var functions = [<!-- [et_pb_line_break_holder] --> 'toggle3d()', 'toggleFloors()', 'toggleSun()',<!-- [et_pb_line_break_holder] --> 'toggleSyntax()', 'issues()', 'helpPopup()'<!-- [et_pb_line_break_holder] --> ]<!-- [et_pb_line_break_holder] --> var functionNames = [<!-- [et_pb_line_break_holder] --> '☑  3D buildings', '☐  Higher LOD', '☐  Shadow study',<!-- [et_pb_line_break_holder] --> '☐  SpaceSyntax', '☐  Comments', 'Need Help?'<!-- [et_pb_line_break_holder] --> ]<!-- [et_pb_line_break_holder] --> var startToggle = ['On', 'Off', 'Off', 'Off', 'Off', 'On']<!-- [et_pb_line_break_holder] --> // Add functions to dropdown to switch activate on click<!-- [et_pb_line_break_holder] --> for (var i = 0; i < functions.length; i++) {<!-- [et_pb_line_break_holder] --> var id = functions[i];<!-- [et_pb_line_break_holder] --> var name = functionNames[i];<!-- [et_pb_line_break_holder] --> var toggle = startToggle[i]<!-- [et_pb_line_break_holder] --> var link = document.createElement('a');<!-- [et_pb_line_break_holder] --> link.href = 'javascript:' + id<!-- [et_pb_line_break_holder] --> link.textContent = name;<!-- [et_pb_line_break_holder] --> link.id = id<!-- [et_pb_line_break_holder] --> link.classList = toggle<!-- [et_pb_line_break_holder] --> var $layerDropdown = document.getElementById('functionDropdown');<!-- [et_pb_line_break_holder] --> $layerDropdown.appendChild(link);<!-- [et_pb_line_break_holder] --> }<!-- [et_pb_line_break_holder] --> <!-- [et_pb_line_break_holder] --> // 3D buildings toggle<!-- [et_pb_line_break_holder] --> var extrusionHeight = []<!-- [et_pb_line_break_holder] --> map.on("load", function(){<!-- [et_pb_line_break_holder] --> extrusionHeight = map.getPaintProperty("buildings", "fill-extrusion-height")<!-- [et_pb_line_break_holder] --> })<!-- [et_pb_line_break_holder] --> function toggle3d(){<!-- [et_pb_line_break_holder] --> if(document.getElementById("toggle3d()").classList == "On") {<!-- [et_pb_line_break_holder] --> map.setPaintProperty("buildings", "fill-extrusion-height", 8)<!-- [et_pb_line_break_holder] --> map.setPaintProperty('floors', "fill-extrusion-opacity", 0);<!-- [et_pb_line_break_holder] --> document.getElementById("toggle3d()").textContent = "☐  3D buildings"<!-- [et_pb_line_break_holder] --> document.getElementById("toggle3d()").classList = "Off"<!-- [et_pb_line_break_holder] --> }<!-- [et_pb_line_break_holder] --> else if(document.getElementById("toggle3d()").classList == "Off") {<!-- [et_pb_line_break_holder] --> map.setPaintProperty("buildings", "fill-extrusion-height", extrusionHeight)<!-- [et_pb_line_break_holder] --> map.setPaintProperty('floors', "fill-extrusion-opacity", 1);<!-- [et_pb_line_break_holder] --> document.getElementById("toggle3d()").textContent = "☑  3D buildings"<!-- [et_pb_line_break_holder] --> document.getElementById("toggle3d()").classList = "On"<!-- [et_pb_line_break_holder] --> }<!-- [et_pb_line_break_holder] --> }<!-- [et_pb_line_break_holder] --><!-- [et_pb_line_break_holder] --> // Higher LOD -- Floors toggle<!-- [et_pb_line_break_holder] --> function toggleFloors() {<!-- [et_pb_line_break_holder] --> if(document.getElementById("toggleFloors()").classList == "Off") {<!-- [et_pb_line_break_holder] --> // First check if map isnt zoomed out too far<!-- [et_pb_line_break_holder] --> // If map is far, zoom slowly to proper zoom level<!-- [et_pb_line_break_holder] --> if(map.getZoom() < 15) {<!-- [et_pb_line_break_holder] --> map.flyTo({zoom: 15, speed: 0.5})<!-- [et_pb_line_break_holder] --> }<!-- [et_pb_line_break_holder] --> else {<!-- [et_pb_line_break_holder] --> map.flyTo({zoom: map.getZoom()+0.0001})<!-- [et_pb_line_break_holder] --> }<!-- [et_pb_line_break_holder] --> map.once('zoomend', function() {<!-- [et_pb_line_break_holder] --> map.setMinZoom(15)<!-- [et_pb_line_break_holder] --> map.setPaintProperty("buildings", "fill-extrusion-opacity", 0)<!-- [et_pb_line_break_holder] --> map.setLayoutProperty('floors', 'visibility', 'visible');<!-- [et_pb_line_break_holder] --> document.getElementById("toggleFloors()").textContent = "☑  Higher LOD"<!-- [et_pb_line_break_holder] --> document.getElementById("toggleFloors()").classList = "On"<!-- [et_pb_line_break_holder] --> })<!-- [et_pb_line_break_holder] --> }<!-- [et_pb_line_break_holder] --> else if(document.getElementById("toggleFloors()").classList == "On") {<!-- [et_pb_line_break_holder] --> map.setLayoutProperty('floors', 'visibility', 'none');<!-- [et_pb_line_break_holder] --> map.setPaintProperty("buildings", "fill-extrusion-opacity", 1)<!-- [et_pb_line_break_holder] --> document.getElementById("toggleFloors()").textContent = "☐  Higher LOD"<!-- [et_pb_line_break_holder] --> document.getElementById("toggleFloors()").classList = "Off"<!-- [et_pb_line_break_holder] --> map.setMinZoom(0)<!-- [et_pb_line_break_holder] --> }<!-- [et_pb_line_break_holder] --> }<!-- [et_pb_line_break_holder] --> // Toggle Sun hours / Shadowstudy<!-- [et_pb_line_break_holder] --> function toggleSun(){<!-- [et_pb_line_break_holder] --> if(document.getElementById("toggleSun()").classList == "Off") {<!-- [et_pb_line_break_holder] --> map.setLayoutProperty('solar', "visibility", "visible");<!-- [et_pb_line_break_holder] --> document.getElementById("toggleSun()").textContent = "☑  Shadow study"<!-- [et_pb_line_break_holder] --> document.getElementById("toggleSun()").classList = "On"<!-- [et_pb_line_break_holder] --> <!-- [et_pb_line_break_holder] --> var popup = new mapboxgl.Popup({closeButton: false, closeOnClick: false})<!-- [et_pb_line_break_holder] --> map.on('mousemove', 'solar', function(e) {<!-- [et_pb_line_break_holder] --> map.getCanvas().style.cursor = 'help';<!-- [et_pb_line_break_holder] --> popup.remove(map)<!-- [et_pb_line_break_holder] --> var features = map.queryRenderedFeatures(e.point, {layers: ["solar"]});<!-- [et_pb_line_break_holder] --> var face = features[0];<!-- [et_pb_line_break_holder] --> var hours = face.properties.hours<!-- [et_pb_line_break_holder] --> popup.setLngLat(e.lngLat)<!-- [et_pb_line_break_holder] --> .setHTML(<!-- [et_pb_line_break_holder] --> '<dd>' + hours + ' hours</dd>' +<!-- [et_pb_line_break_holder] --> '<dt> of sunlight <br>on 1st of August.</dt>'<!-- [et_pb_line_break_holder] --> )<!-- [et_pb_line_break_holder] --> .addTo(map);<!-- [et_pb_line_break_holder] --> })<!-- [et_pb_line_break_holder] --> map.on('mouseleave', 'solar', function(){<!-- [et_pb_line_break_holder] --> map.getCanvas().style.cursor = '';<!-- [et_pb_line_break_holder] --> popup.remove(map);<!-- [et_pb_line_break_holder] --> })<!-- [et_pb_line_break_holder] --> }<!-- [et_pb_line_break_holder] --> else if(document.getElementById("toggleSun()").classList == "On") {<!-- [et_pb_line_break_holder] --> map.setLayoutProperty('solar', "visibility", "none");<!-- [et_pb_line_break_holder] --> document.getElementById("toggleSun()").textContent = "☐  Shadow study"<!-- [et_pb_line_break_holder] --> document.getElementById("toggleSun()").classList = "Off"<!-- [et_pb_line_break_holder] --> }<!-- [et_pb_line_break_holder] --> }<!-- [et_pb_line_break_holder] --><!-- [et_pb_line_break_holder] --> // Toggle SpaceSyntax<!-- [et_pb_line_break_holder] --> function toggleSyntax(){<!-- [et_pb_line_break_holder] --> if(document.getElementById("toggleSyntax()").classList == "Off") {<!-- [et_pb_line_break_holder] --> map.setPaintProperty('syntax', "line-opacity", 1);<!-- [et_pb_line_break_holder] --> document.getElementById("toggleSyntax()").textContent = "☑  SpaceSyntax"<!-- [et_pb_line_break_holder] --> document.getElementById("toggleSyntax()").classList = "On"<!-- [et_pb_line_break_holder] --> }<!-- [et_pb_line_break_holder] --> else if(document.getElementById("toggleSyntax()").classList == "On") {<!-- [et_pb_line_break_holder] --> map.setPaintProperty('syntax', "line-opacity", 0);<!-- [et_pb_line_break_holder] --> document.getElementById("toggleSyntax()").textContent = "☐  SpaceSyntax"<!-- [et_pb_line_break_holder] --> document.getElementById("toggleSyntax()").classList = "Off"<!-- [et_pb_line_break_holder] --> }<!-- [et_pb_line_break_holder] --> }<!-- [et_pb_line_break_holder] --><!-- [et_pb_line_break_holder] --> // Feedback toggle<!-- [et_pb_line_break_holder] --> // Switch between icons visible and hidden<!-- [et_pb_line_break_holder] --> function issues() {<!-- [et_pb_line_break_holder] --> if(document.getElementById("issues()").classList == "Off") {<!-- [et_pb_line_break_holder] --> map.setLayoutProperty("wtp-comments", 'visibility', 'visible');<!-- [et_pb_line_break_holder] --> document.getElementById("issues()").textContent = "☑  Comments"<!-- [et_pb_line_break_holder] --> document.getElementById("issues()").classList = "On"<!-- [et_pb_line_break_holder] --> }<!-- [et_pb_line_break_holder] --> else if(document.getElementById("issues()").classList == "On") {<!-- [et_pb_line_break_holder] --> map.setLayoutProperty("wtp-comments", 'visibility', 'none');<!-- [et_pb_line_break_holder] --> document.getElementById("issues()").textContent = "☐  Comments"<!-- [et_pb_line_break_holder] --> document.getElementById("issues()").classList = "Off"<!-- [et_pb_line_break_holder] --> }<!-- [et_pb_line_break_holder] --> }<!-- [et_pb_line_break_holder] --> // on hover open popup with text info<!-- [et_pb_line_break_holder] --> issuePopup = new mapboxgl.Popup({closeButton: false, closeOnClick: false})<!-- [et_pb_line_break_holder] --> map.on('mouseenter', 'wtp-comments', function(e) {<!-- [et_pb_line_break_holder] --> map.getCanvas().style.cursor = 'pointer';<!-- [et_pb_line_break_holder] --> var coordinates = e.features[0].geometry.coordinates.slice();<!-- [et_pb_line_break_holder] --> var text = e.features[0].properties.text;<!-- [et_pb_line_break_holder] --> var author = e.features[0].properties.author;<!-- [et_pb_line_break_holder] --> issuePopup.setLngLat(coordinates)<!-- [et_pb_line_break_holder] --> .setHTML('<dt>' + text + '</dt>' +<!-- [et_pb_line_break_holder] --> '<br><dd>' + author + '</dd>'<!-- [et_pb_line_break_holder] --> )<!-- [et_pb_line_break_holder] --> .addTo(map);<!-- [et_pb_line_break_holder] --> })<!-- [et_pb_line_break_holder] --> // close it on hover end<!-- [et_pb_line_break_holder] --> map.on('mouseleave', 'wtp-comments', function() {<!-- [et_pb_line_break_holder] --> map.getCanvas().style.cursor = '';<!-- [et_pb_line_break_holder] --> issuePopup.remove();<!-- [et_pb_line_break_holder] --> })<!-- [et_pb_line_break_holder] --><!-- [et_pb_line_break_holder] --><!-- [et_pb_line_break_holder] --> // +++ Other useful functions<!-- [et_pb_line_break_holder] --><!-- [et_pb_line_break_holder] --> // Help popup with controls info<!-- [et_pb_line_break_holder] --> function helpPopup() {<!-- [et_pb_line_break_holder] --> window.popup = new mapboxgl.Popup()<!-- [et_pb_line_break_holder] --> .setLngLat(map.getCenter())<!-- [et_pb_line_break_holder] --> .setHTML( //OLD IE COMPATABLE MUTLILINE STRING<!-- [et_pb_line_break_holder] --> '<dd>How can you explore the model?</dd>' +<!-- [et_pb_line_break_holder] --> '<dt>Click on "Select scenario" to choose between different variants' +<!-- [et_pb_line_break_holder] --> ' or click on buildings to display more information about them.</dt>' +<!-- [et_pb_line_break_holder] --> '<dt><br>To control the camera press Control + Left Mouse Button or use' +<!-- [et_pb_line_break_holder] --> ' one of the preset positions with "Views" menu.</dt>' +<!-- [et_pb_line_break_holder] --> '<dt><br>In the "Functions" menu you can hide the 3D geometry' +<!-- [et_pb_line_break_holder] --> ' and change the Level of Detail or show a demo of feedback system.</dt>'<!-- [et_pb_line_break_holder] --> )<!-- [et_pb_line_break_holder] --> .addTo(map);<!-- [et_pb_line_break_holder] --> }<!-- [et_pb_line_break_holder] --><!-- [et_pb_line_break_holder] --> // Layer with additional data popup on click<!-- [et_pb_line_break_holder] --> activeLayer = 'buildings'<!-- [et_pb_line_break_holder] --> // change the cursor when hovering over this layer<!-- [et_pb_line_break_holder] --> map.on('mouseenter', activeLayer, function(event) {<!-- [et_pb_line_break_holder] --> map.getCanvas().style.cursor = 'help';<!-- [et_pb_line_break_holder] --> }); <!-- [et_pb_line_break_holder] --> map.on('mouseleave', activeLayer, function() {<!-- [et_pb_line_break_holder] --> map.getCanvas().style.cursor = '';<!-- [et_pb_line_break_holder] --> });<!-- [et_pb_line_break_holder] --> // Open popup with GeoJson properties on click<!-- [et_pb_line_break_holder] --> map.on('click', function(event) {<!-- [et_pb_line_break_holder] --> var features = map.queryRenderedFeatures(event.point, {layers: [activeLayer]});<!-- [et_pb_line_break_holder] --> var building = features[0];<!-- [et_pb_line_break_holder] --> <!-- [et_pb_line_break_holder] --> // Keys you want to include<!-- [et_pb_line_break_holder] --> if (features.length) {<!-- [et_pb_line_break_holder] --> var landUse = building.properties.function <!-- [et_pb_line_break_holder] --> '–';<!-- [et_pb_line_break_holder] --> var height = Math.round(building.properties.height) <!-- [et_pb_line_break_holder] --> '–';<!-- [et_pb_line_break_holder] --> var gfa = Math.round(building.properties.GFA) <!-- [et_pb_line_break_holder] --> '–';<!-- [et_pb_line_break_holder] --> var id = building.properties.build_ID <!-- [et_pb_line_break_holder] --> '–';<!-- [et_pb_line_break_holder] --> <!-- [et_pb_line_break_holder] --> // HTML content of the popup<!-- [et_pb_line_break_holder] --> window.popup = new mapboxgl.Popup()<!-- [et_pb_line_break_holder] --> .setLngLat(event.lngLat)<!-- [et_pb_line_break_holder] --> .setHTML( <!-- [et_pb_line_break_holder] --> '<dl>' +<!-- [et_pb_line_break_holder] --> // '<dt>Land Use</dt>' +<!-- [et_pb_line_break_holder] --> // '<dd>' + landUse + '</dd>' +<!-- [et_pb_line_break_holder] --> '<dt>Building Height</dt>' +<!-- [et_pb_line_break_holder] --> '<dd>' + height + ' m' + '</dd>' +<!-- [et_pb_line_break_holder] --> '<dt>GFA</dt>' +<!-- [et_pb_line_break_holder] --> '<dd>' + gfa + ' sqm' + '</dd>' +<!-- [et_pb_line_break_holder] --> '<dt>ID#</dt>' +<!-- [et_pb_line_break_holder] --> '<dd>' + id + '</dd>' +<!-- [et_pb_line_break_holder] --> '</dl>') //OLD IE COMPATABLE MUTLILINE STRING FORMAT<!-- [et_pb_line_break_holder] --> .addTo(map);<!-- [et_pb_line_break_holder] --> };<!-- [et_pb_line_break_holder] --> });<!-- [et_pb_line_break_holder] --><!-- [et_pb_line_break_holder] --><!-- [et_pb_line_break_holder] --> </script>

Acknowledgement The project shown in the example above is a result of interdisciplinary international research project done by the students at the Bauhaus-Universität Weimar (BUW).  We are also grateful to the Singapore-ETH Centre teams Multi-Scale Energy Systems for Low Carbon Cities, Engaging Mobility, and Big Data-Informed Urban Design and Governance for contributing their knowledge, experience and time to the design studio.

Pin It on Pinterest